Appending Dictionaries to Dataframes in Python is a great automation and data visualization tool every programmer must know. Find out how to build Dictionaries from scratch and append them into Dataframes with these bullet-proof methods and techniques!
Before we know how to append dictionary to dataframe python, first we need to briefly understand what Dictionaries and Panda Dataframes are and how we can make them work together. If you’re already familiar with these Python functions and modules, you can skip to our coding examples and solutions using our content tables!
We’ll also cover how to append (or concatenate) dictionaries into Pandas dataframes when you’re given a list of dictionaries. You’ll also learn how to manipulate your neatly organized data through short lines of codes, thanks to this fantastic module!
What are Dictionaries and Panda Data Frames?
Dictionaries are one of Python’sPython’s Mapping Data Types, and they’rethey’re great for associating keys with a value (or a set of values) just like a real dictionary does. We’veWe’ve previously covered how to swap their values and use some of their functions in our Dictionary Length & Dictionary Merge pieces, which unveil some of its almost endless potentials.
On the other hand, Pandas is an open-source Python library that offers many easy-to-use, high-performance data structure functions. Pandas let you handle tables, spreadsheet data (tabular data), and time series in a more streamlined manner. You can align, filter, and group columns, pinpoint specific values, perform statistical analysis by calling a single function, and even add more data to a dataframe by appending dictionaries!
Why Use Python Panda Dataframes?
Pandas lets you efficiently run data analysis tools on large tabular data structures and matrixes, making data science, financial modeling, and statistics work that much easier. Dictionaries and Panda Data Frames are also highly convenient for modifying, expanding, filtering, and running calculations on CSV, Excel, and Google Spreadsheet files.
The best part is that you can manipulate tables through short code lines thanks to Pandas’Pandas’ wide array of powerful functions. All you need for creating dataframes, converting dictionaries into dataframes, and appending a dictionary to a dataframe on VSCode is to have NumPy and Pandas installed in Python. We’ve outlined how to do this in a step-by-step guide at the end of this article.
If you don’tdon’t know how to do this, don’t worry: just follow our step-by-step instructions, and you’ll be golden!
Append Dictionary to Dataframe Python
One of the main advantages of working with Panda is using the append dictionary to dataframe Python function to expand and update all your data quickly. However, you should know that the .append function has been deprecated to give way to the new and improved .concat()function.
For simplicity’s sake, we’ll still refer to the append dictionary to dataframe python function by name. Once the function has been deprecated, you’ll have to transform your dictionary into a Dataframe, and then concatenate them. We’ll use both the original append dictionary to dataframe Python function, as well as the new pd.concat function.
For the following example, we’ll pretend to be compiling and analyzing Miami’s weather conditions for the past month. Each week, we’ll receive data in the form of Python dictionaries from an automated weather balloon that monitors and sends this data to our computer. So far, we’ve only received last week’s batch of information, which we have already converted into a dataframe, as follows:
import numpy as pd
import pandas as pd

weather_data = {
'Miami Counties': ['Miami-Dade', 'Broward', 'Palm Beach', 'Hillsborough', 'Orange County', 'Pinellas County', 'Duval County'],
'Max Temp': [84,78,81,83,85,84,82],
'Min Temp': [77,72,75,71,73,77,75],
'Avg Temp': [81,75,78,77,79,81,79]
}
row_labels = [1, 2, 3, 4, 5, 6, 7]

weather_df = pd.DataFrame(data=weather_data, index=row_labels)
print(weather_df)

Output:

    Miami Counties  Max Temp  Min Temp  Avg Temp
1       Miami-Dade        84        77        81
2          Broward        78        72        75
3       Palm Beach        81        75        78
4     Hillsborough        83        71        77
5    Orange County        85        73        79
6  Pinellas County        84        77        81
7     Duval County        82        75        79
Today, we received our second weeks’ worth of data, as seen below. Our automated weather balloon has sent us a list of dictionaries that we’ll proceed to add, using both the original append function, as well as the new Pandas concatenate function.
We’ll proceed to use our append dictionary to dataframe python function to concatenate this week’s result to our existing data.
import numpy as pd
import pandas as pd

weather_data = {
'Miami Counties': ['Miami-Dade', 'Broward', 'Palm Beach', 'Hillsborough', 'Orange County', 'Pinellas County', 'Duval County'],
'Max Temp': [84,78,81,83,85,84,82],
'Min Temp': [77,72,75,71,73,77,75],
'Avg Temp': [81,75,78,77,79,81,79]
}
row_labels = [1, 2, 3, 4, 5, 6, 7]

weather_df = pd.DataFrame(data=weather_data, index=row_labels)

w2_weather_data = [{'Miami Counties' : 'Lee', 'Max Temp' : '82', 'Min Temp' : 74,'Avg Temp' : 78},
                   {'Miami Counties' : 'Polk', 'Max Temp' : '81', 'Min Temp' : 75,'Avg Temp' : 77},
                   {'Miami Counties' : 'Brevard', 'Max Temp' : '83', 'Min Temp' : 71,'Avg Temp' : 75},
                   {'Miami Counties' : 'Volusia', 'Max Temp' : '80', 'Min Temp' : 72,'Avg Temp' : 73},
                   {'Miami Counties' : 'Pasco', 'Max Temp' : '79', 'Min Temp' : 72,'Avg Temp' : 74},
                   {'Miami Counties' : 'Seminole', 'Max Temp' : '85', 'Min Temp' : 77,'Avg Temp' : 79},
                   {'Miami Counties' : 'Sarasota', 'Max Temp' : '83', 'Min Temp' : 72,'Avg Temp' : 76},]

w2_update = pd.DataFrame()
w2_update = weather_df.append(w2_weather_data)
print(w2_update)

Output:

    Miami Counties Max Temp  Min Temp  Avg Temp
1       Miami-Dade       84        77        81
2          Broward       78        72        75
3       Palm Beach       81        75        78
4     Hillsborough       83        71        77
5    Orange County       85        73        79
6  Pinellas County       84        77        81
7     Duval County       82        75        79
0              Lee       82        74        78
1             Polk       81        75        77
2          Brevard       83        71        75
3          Volusia       80        72        73
4            Pasco       79        72        74
5         Seminole       85        77        79
6         Sarasota       83        72        76
The syntax is simple enough. We assign a variable to the updated version of our Dataframe and append “w2_weather_data” dictionary to it.
Notice that the data has been successfully concatenated by the append dictionary to dataframe python function. But there’s an issue: the index has also transferred, making our data look disorganized and confusing. Thankfully, a command allows you to retain your original index order: The ignore_index=True command. Here’s how we can use it:
import numpy as pd
import pandas as pd

weather_data = {
'Miami Counties': ['Miami-Dade', 'Broward', 'Palm Beach', 'Hillsborough', 'Orange County', 'Pinellas County', 'Duval County'],
'Max Temp': [84,78,81,83,85,84,82],
'Min Temp': [77,72,75,71,73,77,75],
'Avg Temp': [81,75,78,77,79,81,79]
}
row_labels = [1, 2, 3, 4, 5, 6, 7]

weather_df = pd.DataFrame(data=weather_data, index=row_labels)

w2_weather_data = [{'Miami Counties' : 'Lee', 'Max Temp' : '82', 'Min Temp' : 74,'Avg Temp' : 78},
                   {'Miami Counties' : 'Polk', 'Max Temp' : '81', 'Min Temp' : 75,'Avg Temp' : 77},
                   {'Miami Counties' : 'Brevard', 'Max Temp' : '83', 'Min Temp' : 71,'Avg Temp' : 75},
                   {'Miami Counties' : 'Volusia', 'Max Temp' : '80', 'Min Temp' : 72,'Avg Temp' : 73},
                   {'Miami Counties' : 'Pasco', 'Max Temp' : '79', 'Min Temp' : 72,'Avg Temp' : 74},
                   {'Miami Counties' : 'Seminole', 'Max Temp' : '85', 'Min Temp' : 77,'Avg Temp' : 79},
                   {'Miami Counties' : 'Sarasota', 'Max Temp' : '83', 'Min Temp' : 72,'Avg Temp' : 76},]

w2_update = pd.DataFrame()
w2_update = weather_df.append(w2_weather_data, ignore_index=True)
print(w2_update)

Output:

     Miami Counties Max Temp  Min Temp  Avg Temp
0        Miami-Dade       84        77        81
1           Broward       78        72        75
2        Palm Beach       81        75        78
3      Hillsborough       83        71        77
4     Orange County       85        73        79
5   Pinellas County       84        77        81
6      Duval County       82        75        79
7               Lee       82        74        78
8              Polk       81        75        77
9           Brevard       83        71        75
10          Volusia       80        72        73
11            Pasco       79        72        74
12         Seminole       85        77        79
13         Sarasota       83        72        76
Here’s how we’d update our data with the newer Pandas concatenate function.
import numpy as pd
import pandas as pd

weather_data = {
'Miami Counties': ['Miami-Dade', 'Broward', 'Palm Beach', 'Hillsborough', 'Orange County', 'Pinellas County', 'Duval County'],
'Max Temp': [84,78,81,83,85,84,82],
'Min Temp': [77,72,75,71,73,77,75],
'Avg Temp': [81,75,78,77,79,81,79]
}
row_labels = [1, 2, 3, 4, 5, 6, 7]

weather_df = pd.DataFrame(data=weather_data, index=row_labels)

w2_weather_data = [{'Miami Counties' : 'Lee', 'Max Temp' : '82', 'Min Temp' : 74,'Avg Temp' : 78},
                   {'Miami Counties' : 'Polk', 'Max Temp' : '81', 'Min Temp' : 75,'Avg Temp' : 77},
                   {'Miami Counties' : 'Brevard', 'Max Temp' : '83', 'Min Temp' : 71,'Avg Temp' : 75},
                   {'Miami Counties' : 'Volusia', 'Max Temp' : '80', 'Min Temp' : 72,'Avg Temp' : 73},
                   {'Miami Counties' : 'Pasco', 'Max Temp' : '79', 'Min Temp' : 72,'Avg Temp' : 74},
                   {'Miami Counties' : 'Seminole', 'Max Temp' : '85', 'Min Temp' : 77,'Avg Temp' : 79},
                   {'Miami Counties' : 'Sarasota', 'Max Temp' : '83', 'Min Temp' : 72,'Avg Temp' : 76},]

row_labels = [8, 9, 10, 11, 12, 13, 14]

w2_weather_data = pd.DataFrame(data=weather_data, index=row_labels)

w2_update = pd.DataFrame()
w2_update = pd.concat([weather_df, w2_weather_data], ignore_index=True)
print(w2_update)

Output:

     Miami Counties  Max Temp  Min Temp  Avg Temp
0        Miami-Dade        84        77        81
1           Broward        78        72        75
2        Palm Beach        81        75        78
3      Hillsborough        83        71        77
4     Orange County        85        73        79
5   Pinellas County        84        77        81
6      Duval County        82        75        79
7        Miami-Dade        84        77        81
8           Broward        78        72        75
9        Palm Beach        81        75        78
10     Hillsborough        83        71        77
11    Orange County        85        73        79
12  Pinellas County        84        77        81
13     Duval County        82        75        79
Remember that your to-be-appended dictionary’s keys must also have the same name as your dataframe’s column labels. Doing so will guarantee that your key’s values neatly fall into the corresponding column. Otherwise, here’s what will happen:
import numpy as pd
import pandas as pd

weather_data = {
'Miami Counties': ['Miami-Dade', 'Broward', 'Palm Beach', 'Hillsborough', 'Orange County', 'Pinellas County', 'Duval County'],
'Max Temp': [84,78,81,83,85,84,82],
'Min Temp': [77,72,75,71,73,77,75],
'Avg Temp': [81,75,78,77,79,81,79]
}
row_labels = [1, 2, 3, 4, 5, 6, 7]

weather_df = pd.DataFrame(data=weather_data, index=row_labels)

w2_weather_data = [{'Miami Location' : 'Lee', 'Max Temp' : '82', 'Min Temp' : 74,'Avg Temp' : 78},
                   {'Miami Counties' : 'Polk', 'Max Temp' : '81', 'Min Temp' : 75,'Avg Temp' : 77},
                   {'Miami Counties' : 'Brevard', 'Max Temp' : '83', 'Min Temp' : 71,'Avg Temp' : 75},
                   {'Miami Counties' : 'Volusia', 'Max Temp' : '80', 'Min Temp' : 72,'Avg Temp' : 73},
                   {'Miami Counties' : 'Pasco', 'Max Temp' : '79', 'Min Temp' : 72,'Avg Temp' : 74},
                   {'Miami Counties' : 'Seminole', 'Max Temp' : '85', 'Min Temp' : 77,'Avg Temp' : 79},
                   {'Miami Counties' : 'Sarasota', 'Max Temp' : '83', 'Min Temp' : 72,'Avg Temp' : 76},]

w2_update = pd.DataFrame()
w2_update = weather_df.append(w2_weather_data, ignore_index=True)
print(w2_update)

Output:

     Miami Counties Max Temp  Min Temp  Avg Temp Miami Location
0        Miami-Dade       84        77        81            NaN
1           Broward       78        72        75            NaN
2        Palm Beach       81        75        78            NaN
3      Hillsborough       83        71        77            NaN
4     Orange County       85        73        79            NaN
5   Pinellas County       84        77        81            NaN
6      Duval County       82        75        79            NaN
7               NaN       82        74        78            Lee
8              Polk       81        75        77            NaN
9           Brevard       83        71        75            NaN
10          Volusia       80        72        73            NaN
11            Pasco       79        72        74            NaN
12         Seminole       85        77        79            NaN
13         Sarasota       83        72        76            NaN
Notice how Panda won’t return a type error; instead, it’ll automatically create a new column and assign a “NaN” value to “Miami Locations” on the rest of the rows. These brand new key-value pairs are, evidently, missing their respective value, so the module autocompletes them with a “Not a Number” (NaN) value.
Returning to our initial scenario, let’s assume that our weather balloon malfunctioned and failed to send data for the past two weeks. Suddenly, we receive a burst of information from the weather balloon with all the weather data we need to add.
The twist here is that it sent us a list containing two dictionaries (one for each week). Thankfully, we can still execute the append dictionary to dataframe python function on this list of dictionaries and automatically add all of the data in one swoop. Here’s how we can do this:
import numpy as pd
import pandas as pd

weather_data = {
'Miami Counties': ['Miami-Dade', 'Broward', 'Palm Beach', 'Hillsborough', 'Orange County', 'Pinellas County', 'Duval County'],
'Max Temp': [84,78,81,83,85,84,82],
'Min Temp': [77,72,75,71,73,77,75],
'Avg Temp': [81,75,78,77,79,81,79]
}
row_labels = [1, 2, 3, 4, 5, 6, 7]

weather_df = pd.DataFrame(data=weather_data, index=row_labels)

w2_weather_data = [{'Miami Counties' : 'Lee', 'Max Temp' : '82', 'Min Temp' : 74,'Avg Temp' : 78},
                   {'Miami Counties' : 'Polk', 'Max Temp' : '81', 'Min Temp' : 75,'Avg Temp' : 77},
                   {'Miami Counties' : 'Brevard', 'Max Temp' : '83', 'Min Temp' : 71,'Avg Temp' : 75},
                   {'Miami Counties' : 'Volusia', 'Max Temp' : '80', 'Min Temp' : 72,'Avg Temp' : 73},
                   {'Miami Counties' : 'Pasco', 'Max Temp' : '79', 'Min Temp' : 72,'Avg Temp' : 74},
                   {'Miami Counties' : 'Seminole', 'Max Temp' : '85', 'Min Temp' : 77,'Avg Temp' : 79},
                   {'Miami Counties' : 'Sarasota', 'Max Temp' : '83', 'Min Temp' : 72,'Avg Temp' : 76},]

w2_update = pd.DataFrame()
w2_update = weather_df.append(w2_weather_data, ignore_index=True)
print(w2_update)

w4_weather_data = [{'Miami Counties' : 'Manatee County', 'Max Temp' : '82', 'Min Temp' : 74,'Avg Temp' : 78},
                   {'Miami Counties' : 'Collier County', 'Max Temp' : '81', 'Min Temp' : 75,'Avg Temp' : 77},
                   {'Miami Counties' : 'Osceola County', 'Max Temp' : '83', 'Min Temp' : 71,'Avg Temp' : 75},
                   {'Miami Counties' : 'Marion County', 'Max Temp' : '80', 'Min Temp' : 72,'Avg Temp' : 73},
                   {'Miami Counties' : 'Lake County', 'Max Temp' : '79', 'Min Temp' : 72,'Avg Temp' : 74},
                   {'Miami Counties' : 'St. Lucie County', 'Max Temp' : '85', 'Min Temp' : 77,'Avg Temp' : 79},
                   {'Miami Counties' : 'Escambia County', 'Max Temp' : '83', 'Min Temp' : 72,'Avg Temp' : 76}]
w3_weather_data =  [{'Miami Counties' : 'Leon County', 'Max Temp' : '82', 'Min Temp' : 74,'Avg Temp' : 78},
                   {'Miami Counties' : 'Alachua County', 'Max Temp' : '81', 'Min Temp' : 75,'Avg Temp' : 77},
                   {'Miami Counties' : 'St. Johns County', 'Max Temp' : '83', 'Min Temp' : 71,'Avg Temp' : 75},
                   {'Miami Counties' : 'Clay County', 'Max Temp' : '80', 'Min Temp' : 72,'Avg Temp' : 73},
                   {'Miami Counties' : 'Lake County', 'Max Temp' : '79', 'Min Temp' : 72,'Avg Temp' : 74},
                   {'Miami Counties' : 'Okaloosa County', 'Max Temp' : '85', 'Min Temp' : 77,'Avg Temp' : 79},
                   {'Miami Counties' : 'Hernando County', 'Max Temp' : '83', 'Min Temp' : 72,'Avg Temp' : 76},]

w4_update = pd.DataFrame()
w4_update = w2_update.append(w3_weather_data, w4_weather_data)
print(w4_update)

Output:

      Miami Counties Max Temp  Min Temp  Avg Temp
0         Miami-Dade       84        77        81
1            Broward       78        72        75
2         Palm Beach       81        75        78
3       Hillsborough       83        71        77
4      Orange County       85        73        79
5    Pinellas County       84        77        81
6       Duval County       82        75        79
7                Lee       82        74        78
8               Polk       81        75        77
9            Brevard       83        71        75
10           Volusia       80        72        73
11             Pasco       79        72        74
12          Seminole       85        77        79
13          Sarasota       83        72        76
14       Leon County       82        74        78
15    Alachua County       81        75        77
16  St. Johns County       83        71        75
17       Clay County       80        72        73
18       Lake County       79        72        74
19   Okaloosa County       85        77        79
20   Hernando County       83        72        76
Here’s the same concatenation using the pandas.concat() function
import numpy as pd
import pandas as pd

weather_data = {
'Miami Counties': ['Miami-Dade', 'Broward', 'Palm Beach', 'Hillsborough', 'Orange County', 'Pinellas County', 'Duval County'],
'Max Temp': [84,78,81,83,85,84,82],
'Min Temp': [77,72,75,71,73,77,75],
'Avg Temp': [81,75,78,77,79,81,79]
}
row_labels = [1, 2, 3, 4, 5, 6, 7]

weather_df = pd.DataFrame(data=weather_data, index=row_labels)

w2_weather_data = [{'Miami Counties' : 'Lee', 'Max Temp' : '82', 'Min Temp' : 74,'Avg Temp' : 78},
                   {'Miami Counties' : 'Polk', 'Max Temp' : '81', 'Min Temp' : 75,'Avg Temp' : 77},
                   {'Miami Counties' : 'Brevard', 'Max Temp' : '83', 'Min Temp' : 71,'Avg Temp' : 75},
                   {'Miami Counties' : 'Volusia', 'Max Temp' : '80', 'Min Temp' : 72,'Avg Temp' : 73},
                   {'Miami Counties' : 'Pasco', 'Max Temp' : '79', 'Min Temp' : 72,'Avg Temp' : 74},
                   {'Miami Counties' : 'Seminole', 'Max Temp' : '85', 'Min Temp' : 77,'Avg Temp' : 79},
                   {'Miami Counties' : 'Sarasota', 'Max Temp' : '83', 'Min Temp' : 72,'Avg Temp' : 76},]

row_labels = [8, 9, 10, 11, 12, 13, 14]

w2_weather_data = pd.DataFrame(data=weather_data, index=row_labels)

w2_update = pd.DataFrame()
w2_update = pd.concat([weather_df, w2_weather_data], ignore_index=True)

w4_weather_data = [{'Miami Counties' : 'Manatee County', 'Max Temp' : '82', 'Min Temp' : 74,'Avg Temp' : 78},
                   {'Miami Counties' : 'Collier County', 'Max Temp' : '81', 'Min Temp' : 75,'Avg Temp' : 77},
                   {'Miami Counties' : 'Osceola County', 'Max Temp' : '83', 'Min Temp' : 71,'Avg Temp' : 75},
                   {'Miami Counties' : 'Marion County', 'Max Temp' : '80', 'Min Temp' : 72,'Avg Temp' : 73},
                   {'Miami Counties' : 'Lake County', 'Max Temp' : '79', 'Min Temp' : 72,'Avg Temp' : 74},
                   {'Miami Counties' : 'St. Lucie County', 'Max Temp' : '85', 'Min Temp' : 77,'Avg Temp' : 79},
                   {'Miami Counties' : 'Escambia County', 'Max Temp' : '83', 'Min Temp' : 72,'Avg Temp' : 76},
                   {'Miami Counties' : 'Leon County', 'Max Temp' : '82', 'Min Temp' : 74,'Avg Temp' : 78},
                   {'Miami Counties' : 'Alachua County', 'Max Temp' : '81', 'Min Temp' : 75,'Avg Temp' : 77},
                   {'Miami Counties' : 'St. Johns County', 'Max Temp' : '83', 'Min Temp' : 71,'Avg Temp' : 75},
                   {'Miami Counties' : 'Clay County', 'Max Temp' : '80', 'Min Temp' : 72,'Avg Temp' : 73},
                   {'Miami Counties' : 'Lake County', 'Max Temp' : '79', 'Min Temp' : 72,'Avg Temp' : 74},
                   {'Miami Counties' : 'Okaloosa County', 'Max Temp' : '85', 'Min Temp' : 77,'Avg Temp' : 79},
                   {'Miami Counties' : 'Hernando County', 'Max Temp' : '83', 'Min Temp' : 72,'Avg Temp' : 76},]

w4_update = pd.DataFrame()
w4_update = w2_update.append(w4_weather_data, ignore_index=True)
print(w4_update)
Convert Dictionary to Dataframe Python
Before we get to Convert a Dictionary to a Dataframe in Python, we need to create our dictionary. Creating a dictionary from scratch is just as easy as stating your dictionary’s name, followed by an assignment operator = and opening with curly bracers { } to store your keys and their values. You assign your first key and respective value by typing a colon : between them and a comma , at the end (the comma will separate your first key-value pair from the next one).
dictionary = {
    <key>: [<value>,<value>,…,<value>,],
    <key>: [<value>,<value>,…,<value>,],
    …
    <key>: [<value>,<value>,…,<value>,],
}
Let’s say we keep a weather record of Temperature, Humidity, Wind, Wind Speed, and Wind Conditions during key hours throughout the day. We can store our daily data in a dictionary by assigning values to specific keys. Our daily record shows:
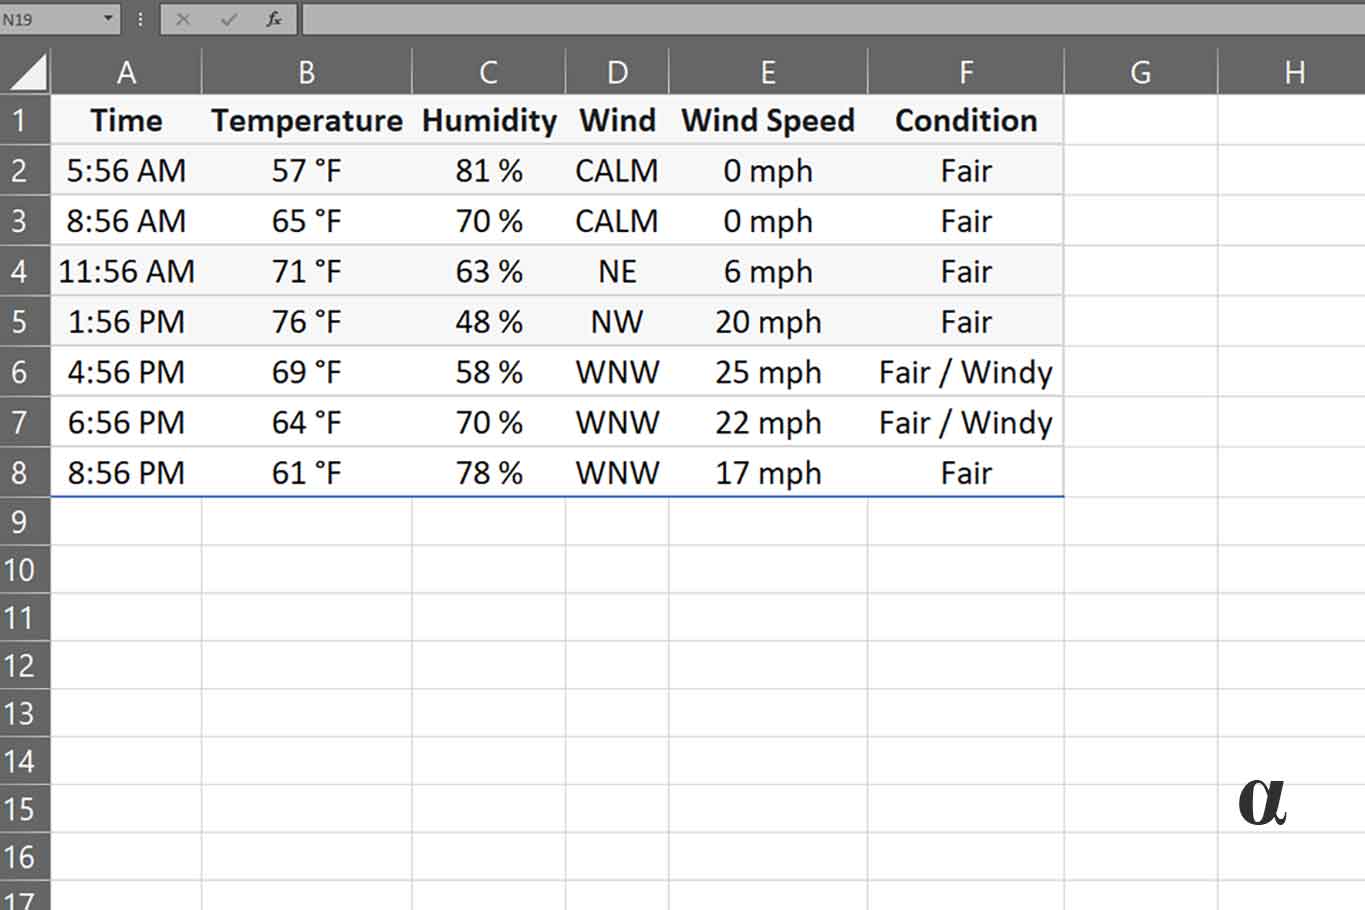
We can reproduce our table into a dictionary by naming our dictionary and filling in our keys as our table headers, each of which will have a list of values entered in the same order as our table presents them. We’ll also use Pandas functions to convert our dictionary to a dataframe, so we’ll begin by importing the NumPy and Pandas libraries to our file.
import numpy as np
import pandas as pd

Day_Weather = {
    'Time': ['5:56 AM', '8:56 AM','11:56 AM', '1:56 PM', '4:56 PM', '6:56 PM', '8:56 PM'],
    'Temperature': ['57 °F', '65 °F', '71 °F', '76 °F', '69 °F', '64 °F', '61 °F'],
    'Humidity': ['81 %', '70 %', '63 %', '48 %', '58 %', '70 %', '78 %'],
    'Wind': ['Calm', 'Calm', 'NE', 'NW', 'WNW', 'WNW', 'WNW'],
    'Wind Speed': ['0 mph', '0 mph', '6 mph', '20 mph', '25 mph', '22 mph', '17 mph'],
    'Condition': ['Fair', 'Fair', 'Fair', 'Fair', 'Fair/Windy', 'Fair/Windy', 'Fair']
}
Now that we have our dictionary, we can convert it into a dataframe by calling in the pd.DataFrame function, and assigning the output to a variable. We’ll also define our index with the row_lables variable and specify where the function can draw all the data it needs (in this case, our dictionary).
import numpy as np
import pandas as pd

Day_Weather = {
    'Time': ['5:56 AM', '8:56 AM','11:56 AM', '1:56 PM', '4:56 PM', '6:56 PM', '8:56 PM'],
    'Temperature': ['57 °F', '65 °F', '71 °F', '76 °F', '69 °F', '64 °F', '61 °F'],
    'Humidity': ['81 %', '70 %', '63 %', '48 %', '58 %', '70 %', '78 %'],
    'Wind': ['Calm', 'Calm', 'NE', 'NW', 'WNW', 'WNW', 'WNW'],
    'Wind Speed': ['0 mph', '0 mph', '6 mph', '20 mph', '25 mph', '22 mph', '17 mph'],
    'Condition': ['Fair', 'Fair', 'Fair', 'Fair', 'Fair/Windy', 'Fair/Windy', 'Fair']
}
row_labels = [1, 2, 3, 4, 5, 6, 7]

dayweather_df = pd.DataFrame(data=Day_Weather, index=row_labels)
Finally, we call the print function so the terminal can show us the dataframe we’ve created from our dictionary.
import numpy as np
import pandas as pd

Day_Weather = {
    'Time': ['5:56 AM', '8:56 AM','11:56 AM', '1:56 PM', '4:56 PM', '6:56 PM', '8:56 PM'],
    'Temperature': ['57 °F', '65 °F', '71 °F', '76 °F', '69 °F', '64 °F', '61 °F'],
    'Humidity': ['81 %', '70 %', '63 %', '48 %', '58 %', '70 %', '78 %'],
    'Wind': ['Calm', 'Calm', 'NE', 'NW', 'WNW', 'WNW', 'WNW'],
    'Wind Speed': ['0 mph', '0 mph', '6 mph', '20 mph', '25 mph', '22 mph', '17 mph'],
    'Condition': ['Fair', 'Fair', 'Fair', 'Fair', 'Fair/Windy', 'Fair/Windy', 'Fair']
}
row_labels = [1, 2, 3, 4, 5, 6, 7]

dayweather_df = pd.DataFrame(data=Day_Weather, index=row_labels)

print(dayweather_df)

# Output:

       Time Temperature Humidity  Wind Wind Speed   Condition
1   5:56 AM       57 °F     81 %  Calm      0 mph        Fair
2   8:56 AM       65 °F     70 %  Calm      0 mph        Fair
3  11:56 AM       71 °F     63 %    NE      6 mph        Fair
4   1:56 PM       76 °F     48 %    NW     20 mph        Fair
5   4:56 PM       69 °F     58 %   WNW     25 mph  Fair/Windy
6   6:56 PM       64 °F     70 %   WNW     22 mph  Fair/Windy
7   8:56 PM       61 °F     78 %   WNW     17 mph        Fair
That’s it! That’s how you Convert Dictionary to Dataframe Python structure!
Converting Dictionary to Dataframe Python Example
Let’s say you’ve scraped a Top NBA players table from an online website, and it’s now in dictionary form. An excellent way to improve your data’s visibility and long-term update potential would be to turn it into a dataframe.
import numpy as pd
import pandas as pd

nba_top_10 = {
'Name': ['Bill Russell', 'Sam Jones', 'John Havlicek', 'Kareem Abdul-Jabbar', 'Bob Cousy', 'Michael Jordan', 'Scottie Pippen', 'Magic Johnson', 'George Mikan', 'Shaquille ONeal'],
'Pos': ['C','G','F/G','C','G','G','F','G','C','C'],
'Pts': ['14,522','15,411','26,395','38,387','16,960','32,292','18,940','17,707','10,156','28,596'],
'Reb': ['21,620','4,305','8,007','17,440','4,786','6,672','7,494','6,559','4,167','13,099'],
'Ast': ['4,100','2,209','6,114','5,660','6,955','5,633','6,135','10,141','1,245','3,026'],
'Championships won': [11,10,8,6,6,6,6,5,5,4],
'MVP won': [5,0,0,6,1,5,0,3,0,1],
'Finals MVP won': [0,0,1,2,0,6,0,3,0,3],
'All Star': [12,5,13,19,13,14,7,12,4,15]
}
You can turn this dict into a dataframe by stating our row count and index with a “row_labels” variable and then calling the pd.DataFrame function. We can ask our function to draw data straight from the dictionary we scraped earlier.
import numpy as pd
import pandas as pd

nba_top_10 = {
'Name': ['Bill Russell', 'Sam Jones', 'John Havlicek', 'Kareem Abdul-Jabbar', 'Bob Cousy', 'Michael Jordan', 'Scottie Pippen', 'Magic Johnson', 'George Mikan', 'Shaquille ONeal'],
'Pos': ['C','G','F/G','C','G','G','F','G','C','C'],
'Pts': ['14,522','15,411','26,395','38,387','16,960','32,292','18,940','17,707','10,156','28,596'],
'Reb': ['21,620','4,305','8,007','17,440','4,786','6,672','7,494','6,559','4,167','13,099'],
'Ast': ['4,100','2,209','6,114','5,660','6,955','5,633','6,135','10,141','1,245','3,026'],
'Championships won': [11,10,8,6,6,6,6,5,5,4],
'MVP won': [5,0,0,6,1,5,0,3,0,1],
'Finals MVP won': [0,0,1,2,0,6,0,3,0,3],
'All Star': [12,5,13,19,13,14,7,12,4,15]
}

row_labels = [1, 2, 3, 4, 5, 6, 7, 8, 9, 10]
nba_df = pd.DataFrame(data=nba_top_10, index=row_labels)

print(nba_df)
Run this program and the terminal will show:
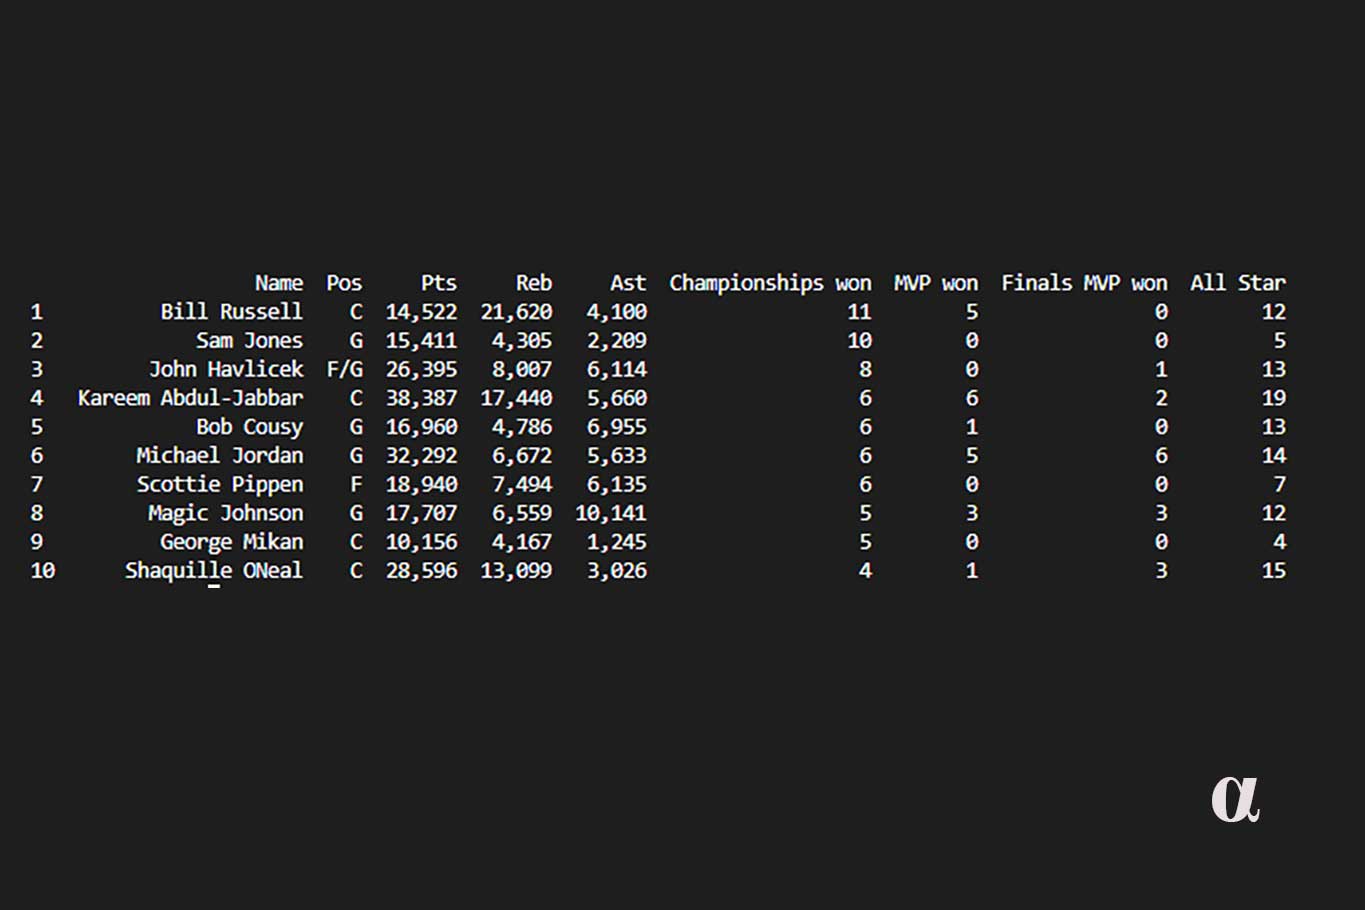
Sadly, the table you scraped from your favorite NBA statistics website hasn’t been updated in a long time. Some outstanding players, such as LeBron James, are currently missing, and there’s seemingly no way to compare their stats.
However, thanks to dictionaries and dataframes, we can update and improve our stats table in a jiff! First, create a small dictionary beneath and place where the print function used to be located:
import numpy as pd
import pandas as pd

nba_top_10 = {
'Name': ['Bill Russell', 'Sam Jones', 'John Havlicek', 'Kareem Abdul-Jabbar', 'Bob Cousy', 'Michael Jordan', 'Scottie Pippen', 'Magic Johnson', 'George Mikan', 'Shaquille ONeal'],
'Pos': ['C','G','F/G','C','G','G','F','G','C','C'],
'Pts': ['14,522','15,411','26,395','38,387','16,960','32,292','18,940','17,707','10,156','28,596'],
'Reb': ['21,620','4,305','8,007','17,440','4,786','6,672','7,494','6,559','4,167','13,099'],
'Ast': ['4,100','2,209','6,114','5,660','6,955','5,633','6,135','10,141','1,245','3,026'],
'Championships won': [11,10,8,6,6,6,6,5,5,4],
'MVP won': [5,0,0,6,1,5,0,3,0,1],
'Finals MVP won': [0,0,1,2,0,6,0,3,0,3],
'All Star': [12,5,13,19,13,14,7,12,4,15]
}

row_labels = [1, 2, 3, 4, 5, 6, 7, 8, 9, 10]

nba_df = pd.DataFrame(data=nba_top_10, index=row_labels)

lebron_dict = {
'Name': ['Lebron James'],
'Pos': ['F'],
'Pts': ['37,062'],
'Reb': ['10,210'],
'Ast': ['10045'],
'Championships won': [4],
'MVP won': [4],
'Finals MVP won': [4],
'All Star': [18]
}
We’ve filled our new dictionary with LeBron’s relevant historical data and ensured that each of our keys matches our dataframe’s label names. We then turn the Lebron Dictionary into a dataframe by adding the following lines of code:
row_labels = [11]

lebron_df = pd.DataFrame(data=lebron_dict, index=row_labels)
Now that we’ve turned our new dictionary into a dataframe, we can call on the pandas.concat() function to merge these two objects. First, we’ll define our new dataframe as nba_update, and then we’ll combine our original dataframe (nba_df) with our smaller lebron_df.
lebron_dict = {
'Name': ['Lebron James'],
'Pos': ['F'],
'Pts': ['37,062'],
'Reb': ['10,210'],
'Ast': ['10045'],
'Championships won': [4],
'MVP won': [4],
'Finals MVP won': [4],
'All Star': [18]
}

row_labels = [11]

lebron_df = pd.DataFrame(data=lebron_dict, index=row_labels)

nba_update = pd.DataFrame()
nba_update = pd.concat([nba_df, lebron_df], ignore_index=True)
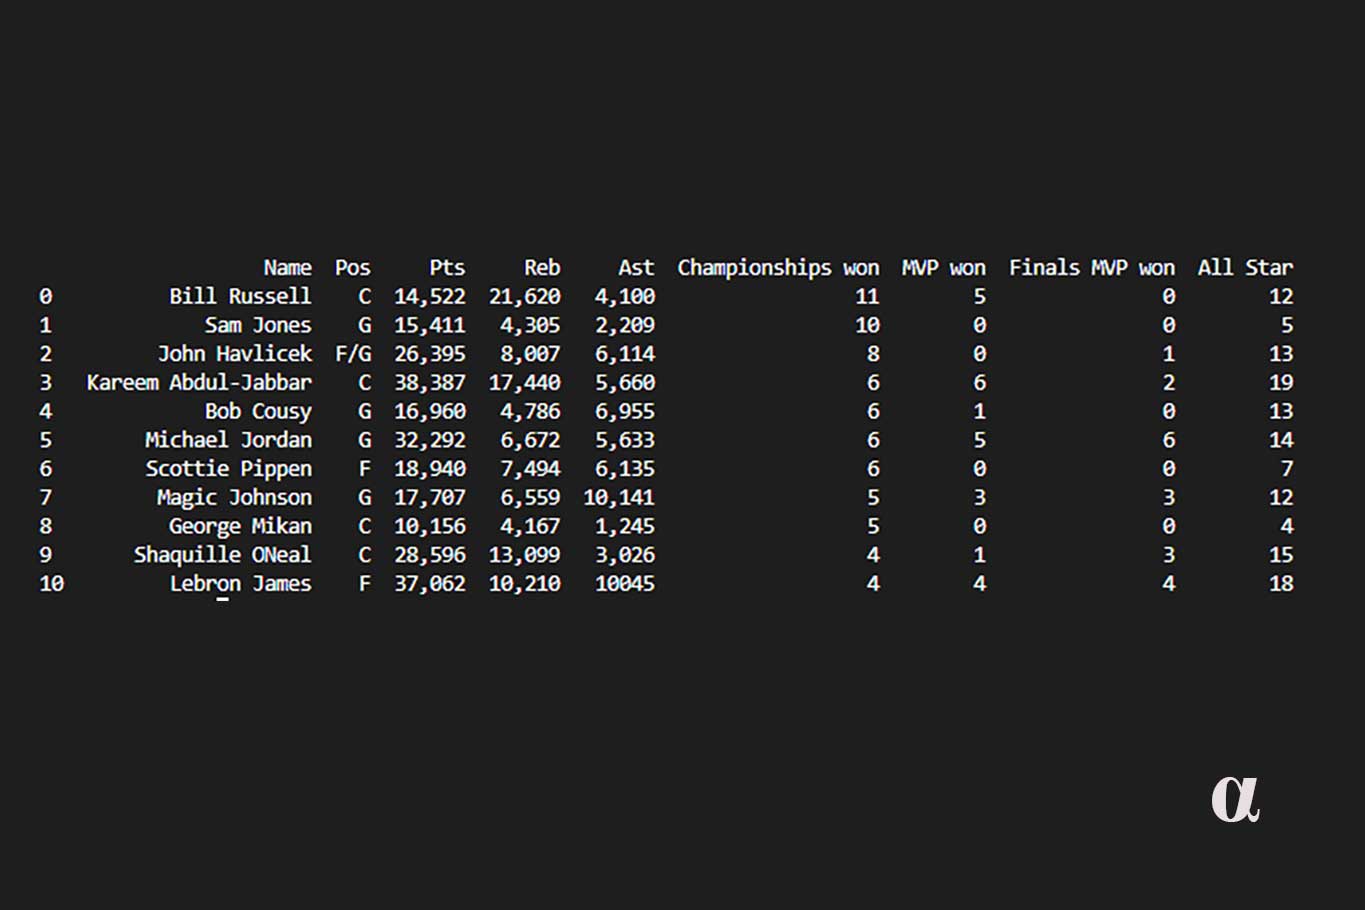
By printing nba_update, your terminal will show your initial Top NBA Players table, only this time it includes King James in its ranks!
Installing NumPy and Panda in VSCode
Close your VSCode and follow these steps to install NumPy and Panda in Visual Studio
If you’re using Linux or macOS:
- Open the terminal
- Type pip install pandas
If you’re using Windows:
- Open command prompt as an admin
- Type python -m pip install pandas
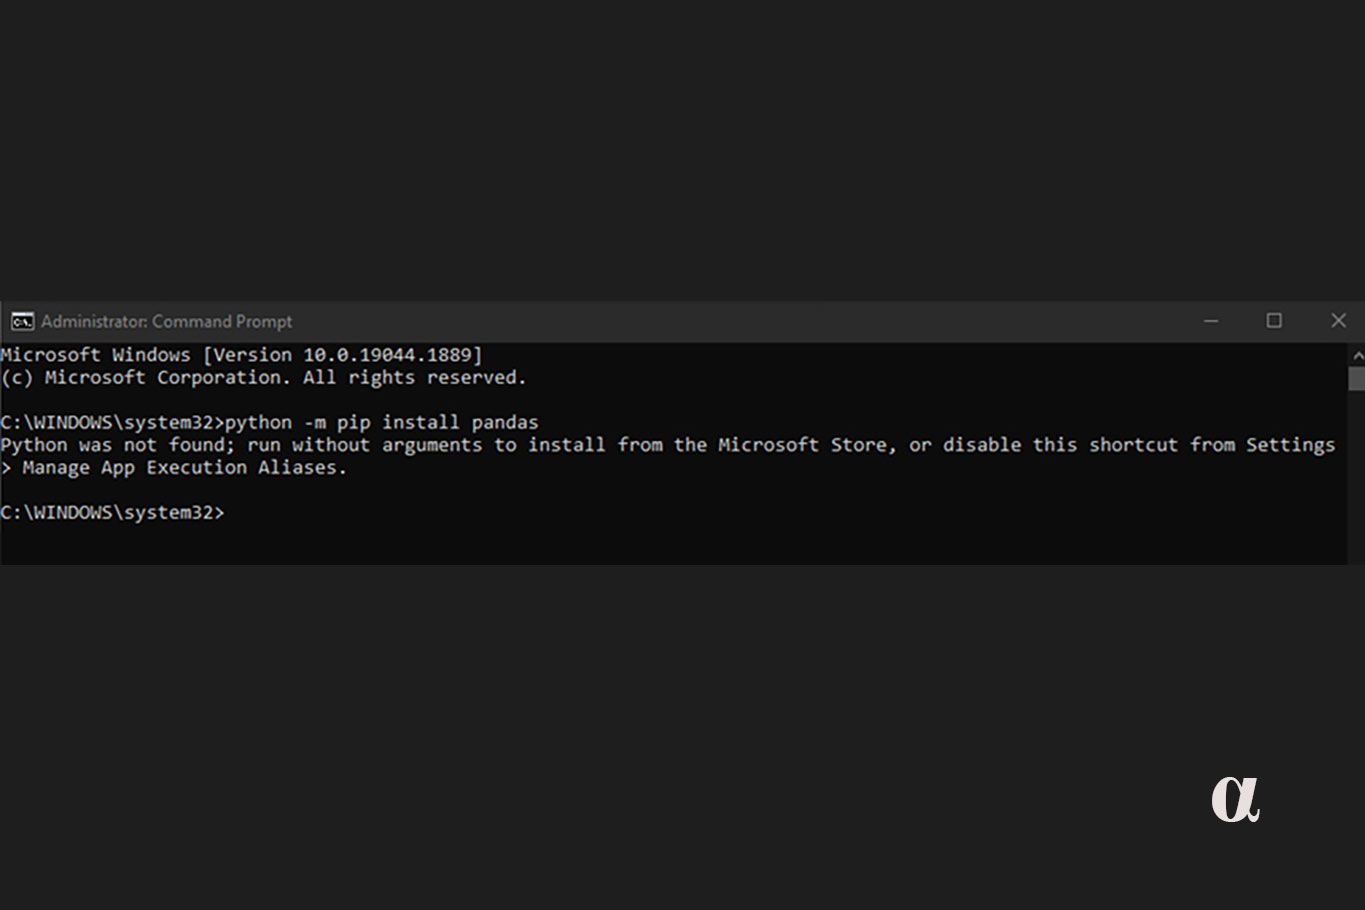
If you run into this error, then it means that Windows 10 can’t detect your previous Python installation. Type “python” into the command prompt to order your Microsoft Store to download Python from scratch.
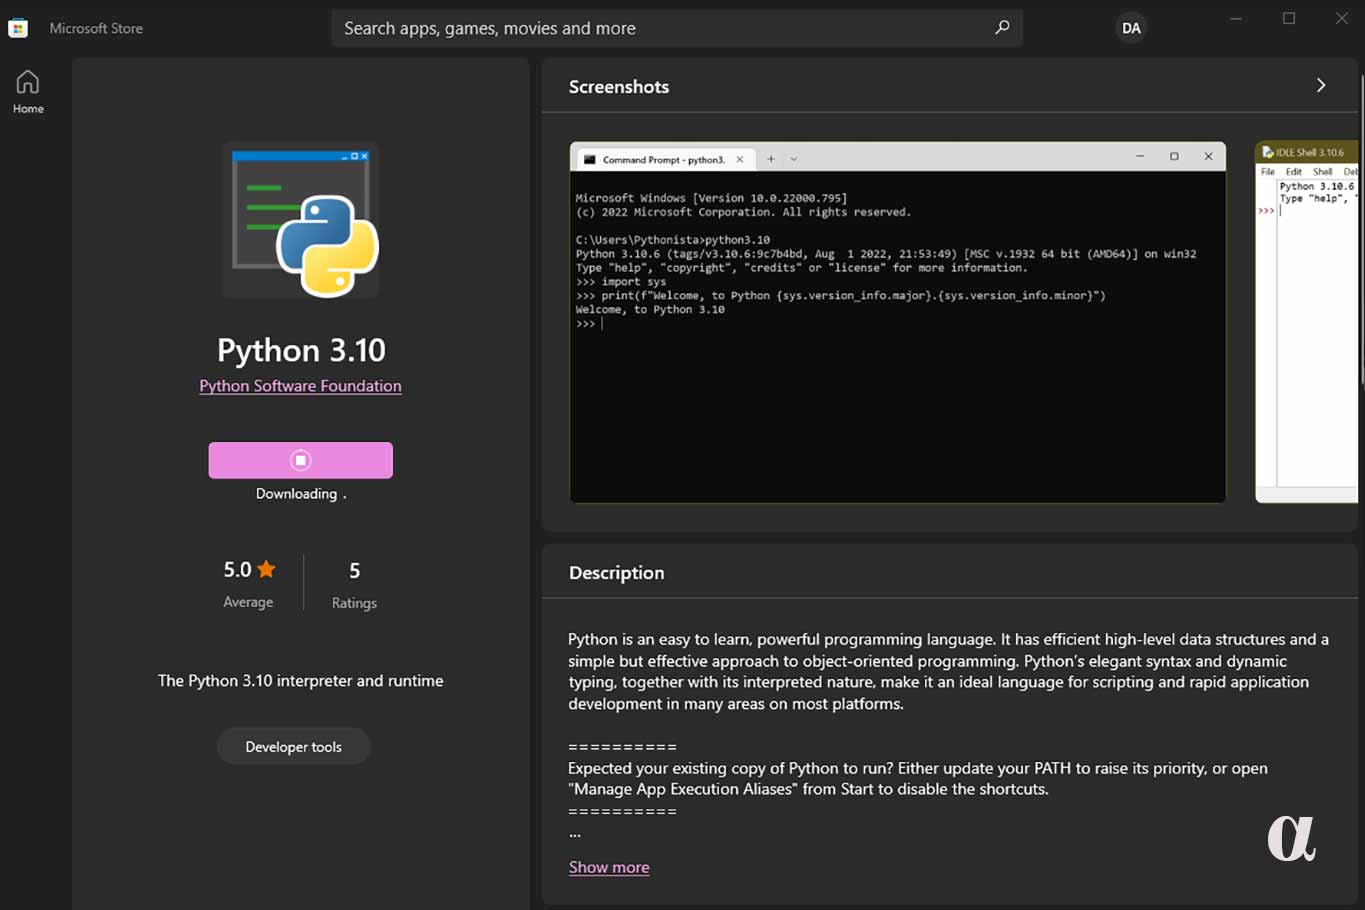
Once you’ve finished installing Python through the app store, type the initial command prompt once more to install Pandas (python -m pip install pandas). Windows users will notice their command prompt downloading panda and its necessary dependencies, including NumPy.
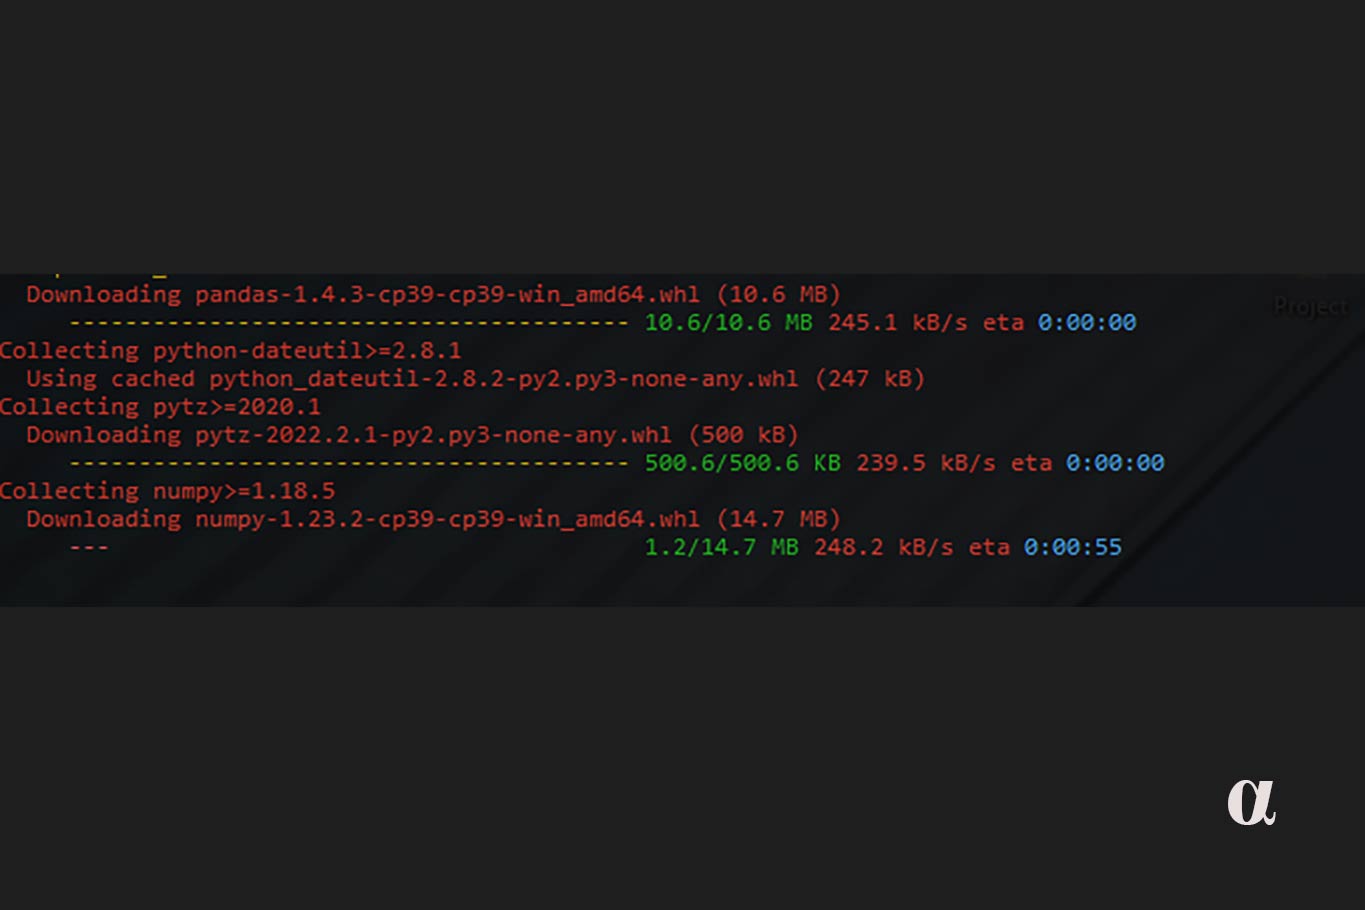
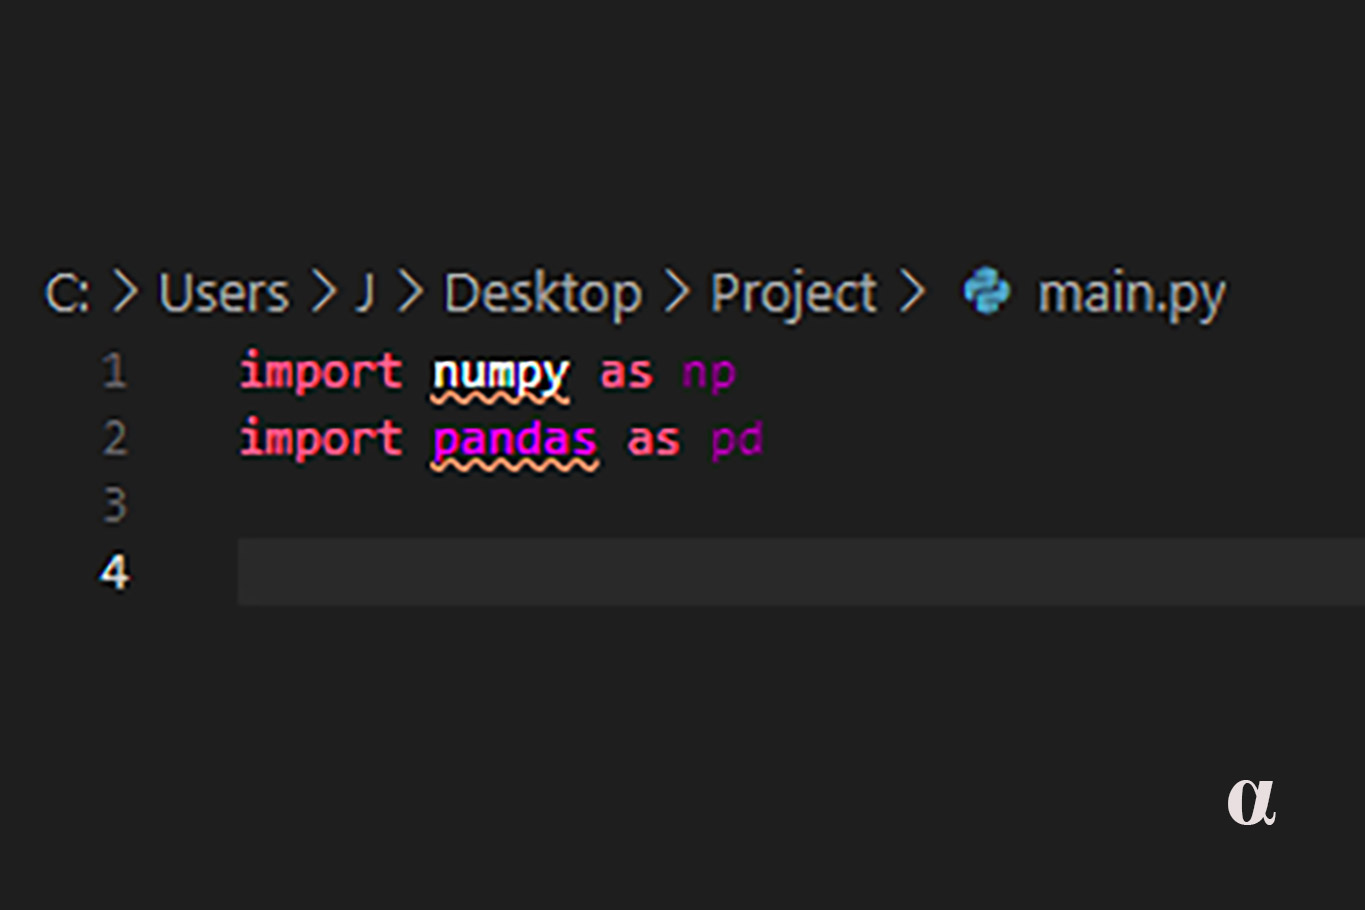
Once it finishes updating and installing all the modules, start your VSCode to access your folder and .py file (or create a brand new one), then type copy paste the following lines at the start of your code:
import numpy as np
import pandas as pd
Usually, this should do the trick. However, if your modules are both underlined, then that means that VSCode still cannot recognize NumPy and Pandas.
If you encounter this error, you’ll need to ensure your interpreter uses the PATH where your Python modules are located. You’ll find the select language mode button on the bottom right corner of your VSCode window.
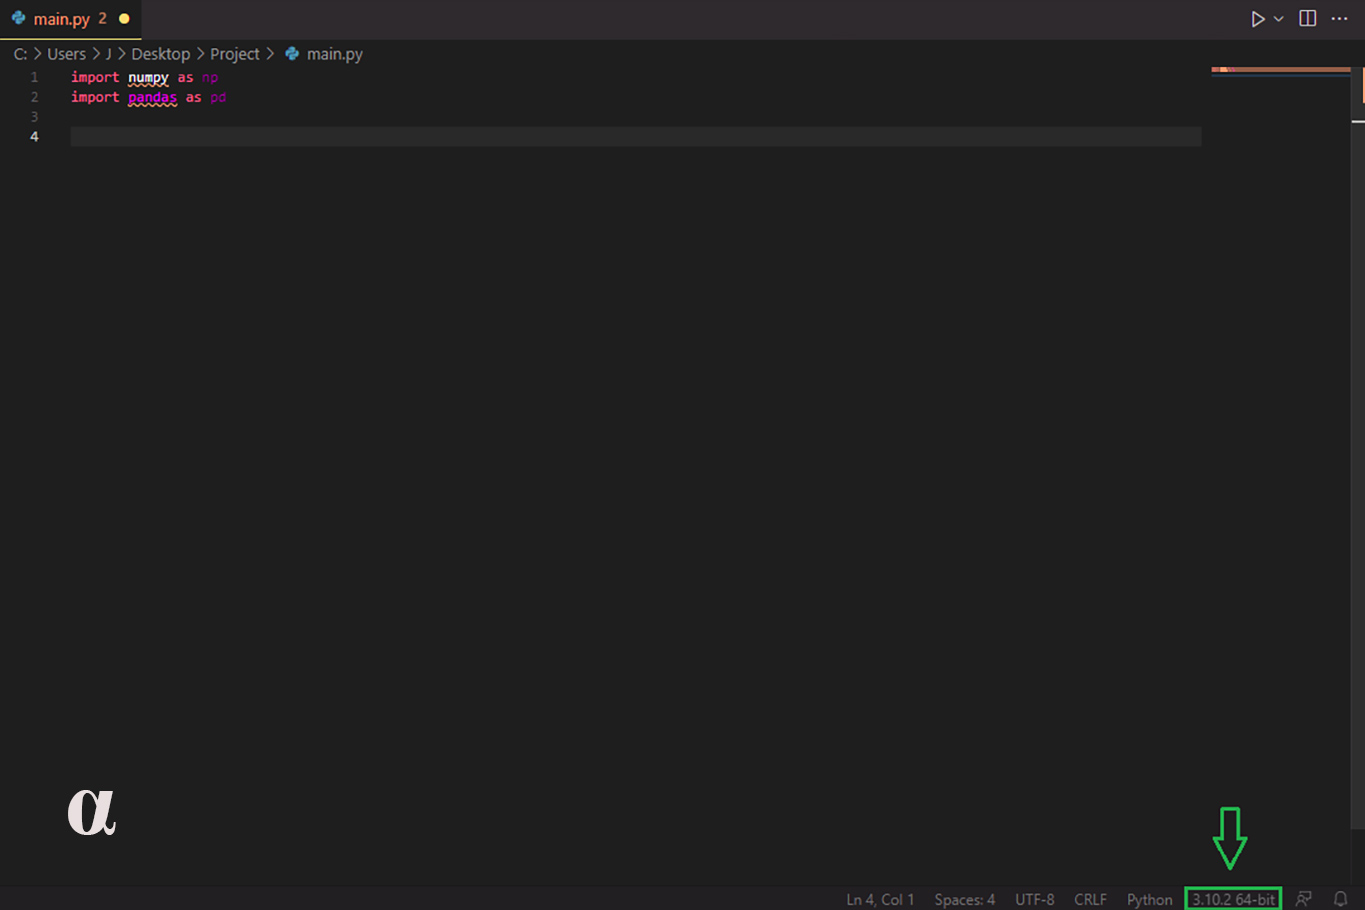
Clicking it will open the select interpreter window, which shows up right below your VSCode navigation bar.
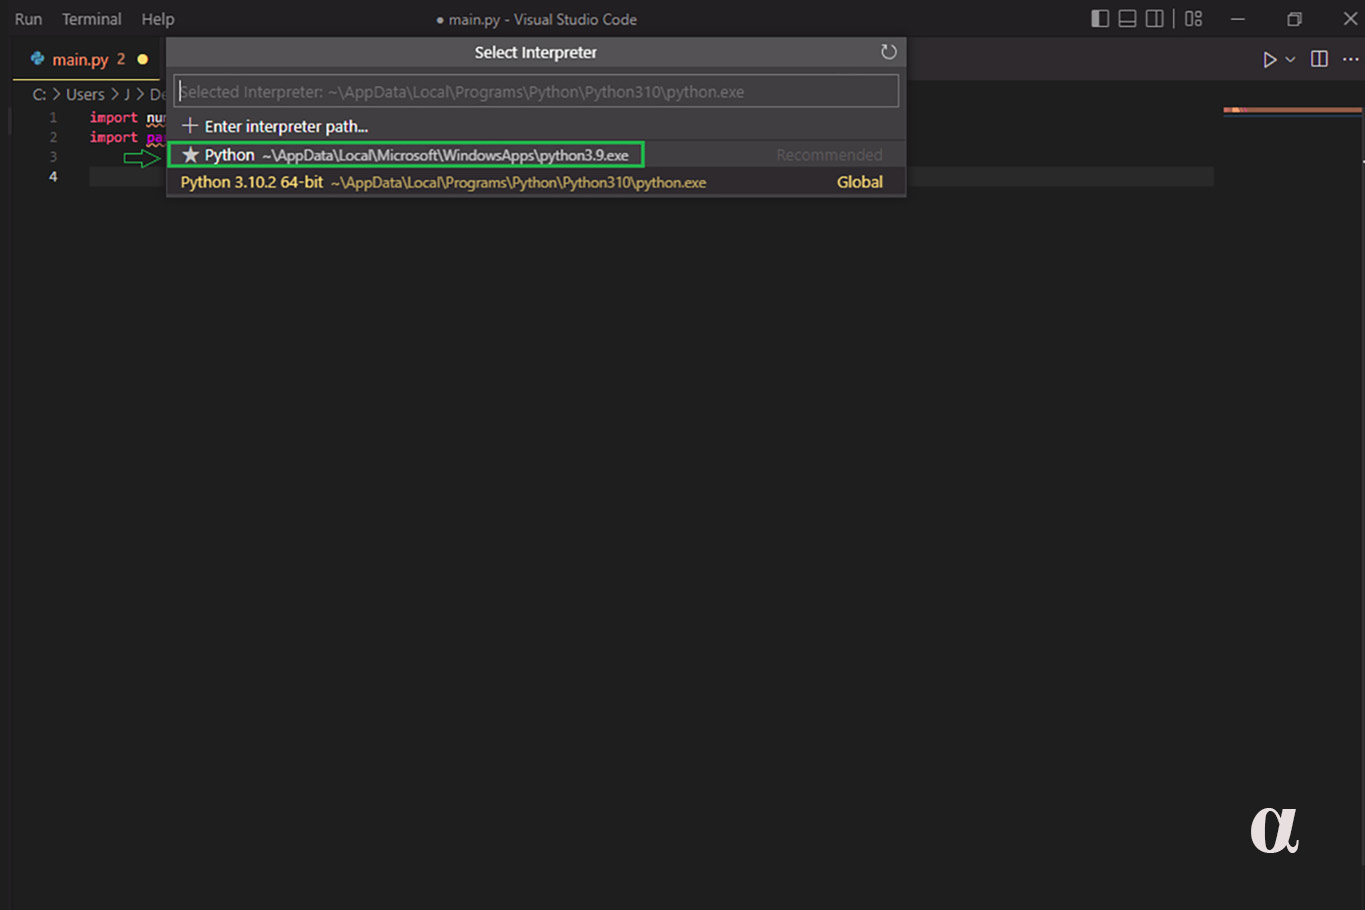
Select the recommended path (the one with a star at its left). This should allow your VSCode to recognize and import the NumPy and Pandas module into your Python files. You’re all set for creating dataframes, converting dictionaries into dataframes, and appending a dictionary to a dataframe!
If you still can’t get your VSCode to install NumPy and pandas, then we’ll have to install pip through the VSCode Extensions tab. Press Control+Shift+X or click on the Extensions icon.

Then search for the Pip Manager extension and install it. Once it’s done, restart VScode. Next, go into your VSCode terminal window and enter
pip install numpy
pip install pandas
Re-check that VSCode is using the correct interpreter, and you should be good to go!


