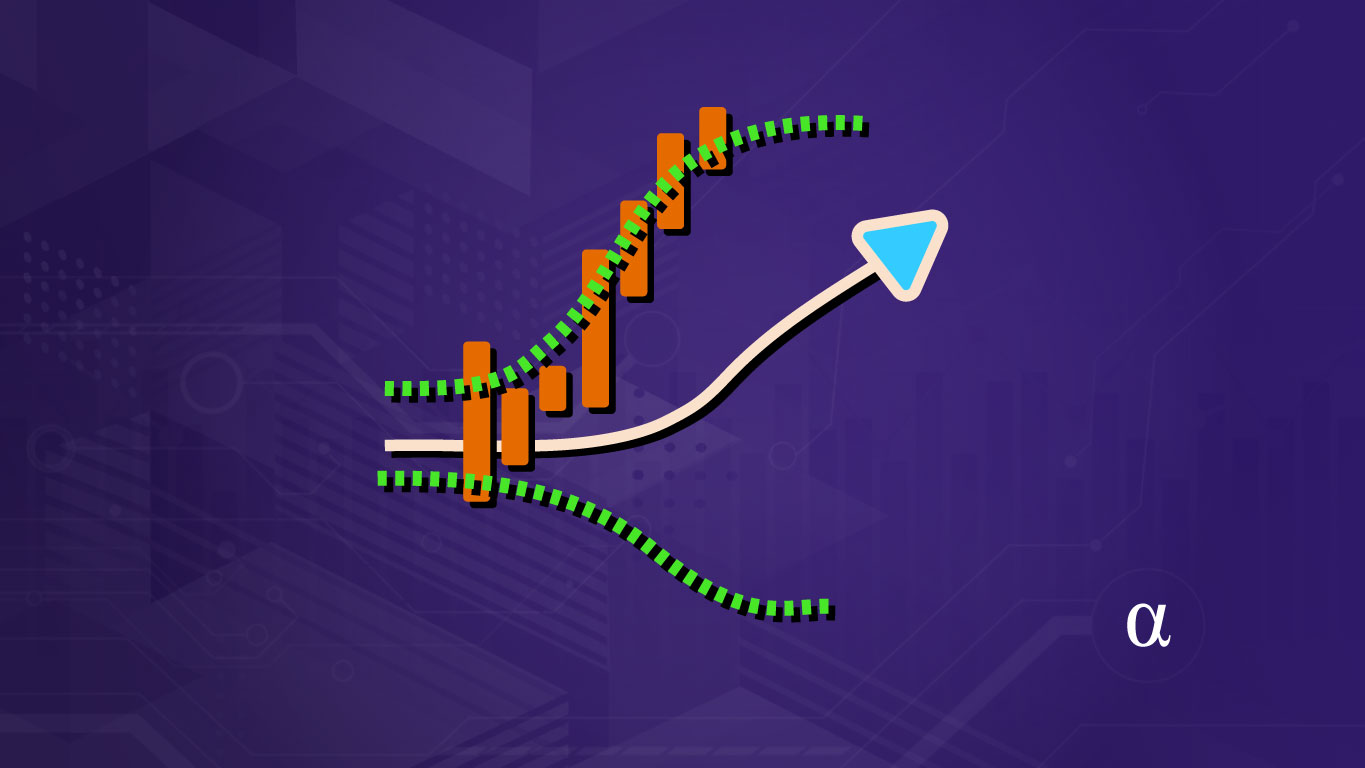
Bollinger Bands are a type of volatility indicator used to describe the relative range of observed values over a period of time. In stock analysis, the Bollinger Bands provide insight into the relative high and low pricing over a given period of time. These values can help predict shifts in trends and are useful to time entries and exits in market positions.
The Bollinger Bands were developed by John Bollinger in the 1980s and remain a popular technical indicator today. They create a band (a.k.a. envelope) encompassing a range of high and low prices relative to a period of time. This representation can indicate an overbought or oversold market and help signal price movements.
Bollinger Bands 101
The Bollinger Bands consist of three primary components and two derivative calculations. These values take into account a number of previous trading periods (lookback period) and are based on a midline representing a moving average of the price over that period. Generally, a simple moving average (SMA). The three core values of the Bollinger Bands are as follows:
- Upper Band – Set above the midline at a factor (typically 2) of the standard deviation of the midline value.
- Midline – The Moving Average over the lookback period (Typically an SMA of 20)
- Lower Band – Set below the midline as a factor (typically 2) of the standard deviation of the midline value.
Additionally, John Bollinger developed another statistic known as the %b which indicates where the current price action is relative to the upper and lower bands. The %b is a form of stochastic that can be thought to provide a normalized interpretation of Bollinger Band values. This value is interpreted as follows:
- %b < 0: The price is below the lower band
- %b = 0: The price is exactly equal to the lower band
- 0 < %b < 0.5: The price is below the midline, but above the bottom band
- %b = 0.5: The price is exactly the value of the midline value
- 0.5 < %b < 1.0: The price is between the midline and upper band
- %b = 1.0: The price is exactly equal to the upper band value
- %b > 1.0: The price is above the upper band
The %b value is essentially a real-time interpretation of the current state of the price action as determined by the Bollinger Bands. This value can be used to generate trade signals from the Bollinger Bands indicator.
The distance between the upper and lower bands can also be used to signal trend reversals, breakouts, and other movements indicated by sharp price changes. This value is commonly referred to as the Band Width.
Calculation
The Bollinger Bands can be calculated in a series of steps. These result in a moving average (used as the midline), the standard deviation, and a value indicating the factor of the standard deviation to use for bandwidth. Below are the calculations:
- Simple Moving Average of the price over n-many periods (20 is the default);
- The Standard Deviation of the previous SMA calculation;
- The SMA plus/minus the Standard Deviation multiplied by a factor (d) to determine bandwidth (2 is the default)
These three calculations establish the midline (SMA), the lower band (SMA – StdDev * d), and the upper band (SMA + StdDev * d). The formula for these calculations can be written as such:
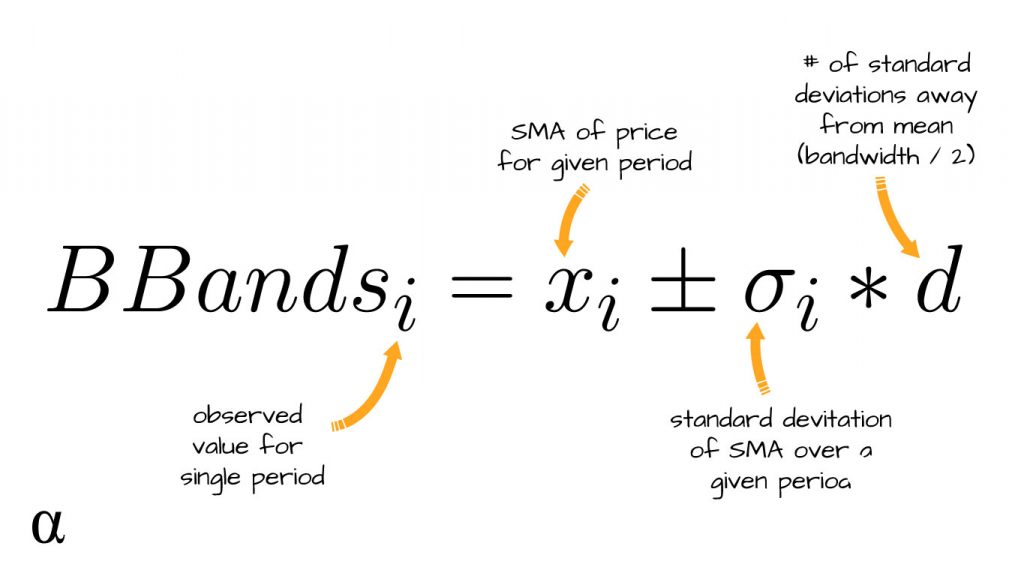
This may all seem a bit abstract. Mathematical formulas are useful to inform one’s coding strategies but often fall short in representing the practical use of things. Here is a chart displaying the Bollinger Bands with each element labeled accordingly:
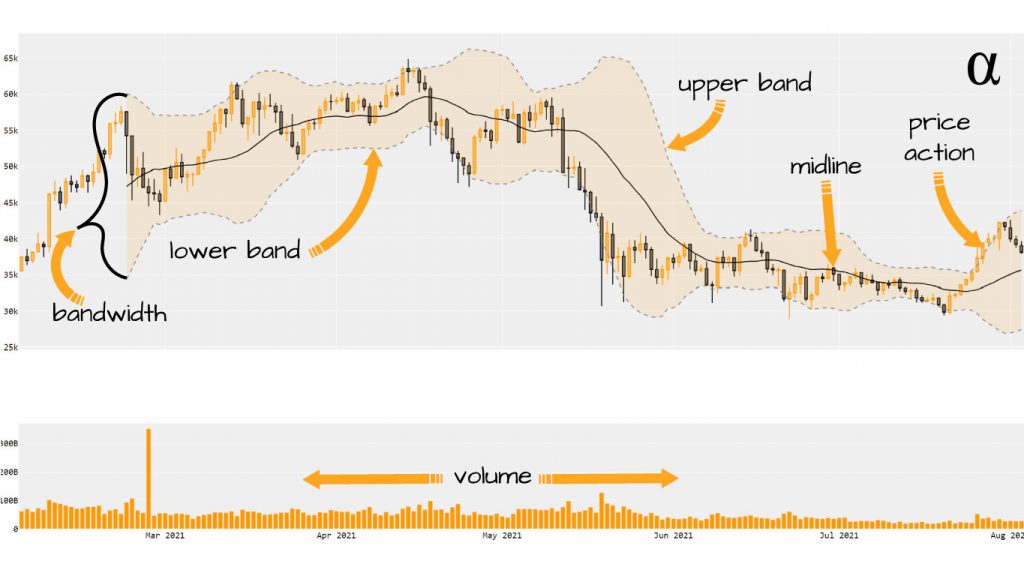
We see here a 1-year pricing history charted as a Candlestick chart with the upper, lower, and midlines of the Bollinger Bands overlayed. The distance between the upper and lower bands reflects the band width. Shown below the pricing history is a histogram plot of the volume during this period—a common accompaniment to Bollinger Bands visualizations.
Interpretation
The Bollinger Bands can be interpreted in a number of ways both on their own and as an accompaniment to other indicators. The broadest interpretation is described by John Bollinger as such:
Bollinger Bands define high and low on a relative basis. By definition prices are high at the upper band and low at the lower band.
It doesn’t get simpler than that! Knowing whether a price is relatively high or low doesn’t necessarily offer much in the way of informing a trading decision. As such, also described by John, relatively low or high pricing values—as interpreted by the Bollinger Bands’ calculations—are NOT to be used as buy/sell signals in and of themselves.
On his website, bollingerbands.com, John Bollinger maintains a list of Bollinger Band Rules which outline key interpretation guidance distilled from his many years of trading. I suggest anyone interested in learning how to interpret the Bollinger Bands to become intimately familiar with this list. Below are a few cherry-picked rules:
- Initial closing prices outside the Bollinger Bands are signals of trend continuation—not reversals.
- Pricing can walk up/down Bollinger Bands in trending markets without reversals;
- Bollinger band values are relative pricing descriptions. The price is considered relatively high at the upper band and relatively low at the lower band.
- Appropriate indicators can be derived from momentum, volume, sentiment, open interest, inter-market data, etc.
- Bollinger Bands can be used on most financial time series, including equities, indices, foreign exchange, commodities, futures, options, and bonds.
- Bollinger Bands can be used on bars of any length, 5 minutes, one hour, daily, weekly, etc.
These are but a few of the many Bollinger Band rules posted by John on his website. They detail insights and strategic observations made by John, his team, and likely others over a collective 30+ years of using the Bollinger Bands as a trading indicator.
These rules, taken alongside other interpretive means, can be applied to develop algorithmic or discretionary trading strategies. These can be direct inclusions of the Bollinger Bands or more complex strategies such as regression modeling to predict stock prices. Below are some common strategies utilizing the Bollinger Bands.
Trading Strategies
Among the many strategies utilizing the Bollinger Bands, there is one common thread—they take into account a market’s overbought or oversold status. The Bollinger Bands are best used with other indicators to generated trade signals. This perspective is noted both implicitly and explicitly several times in the Bollinger Bands Rules mentioned earlier (as well as countless other sources.)
Those relying solely on the touches of the upper or lower bands for trade signals are likely to see an annoyingly frequent series of premature stop-outs or losses. Below are some basic strategies that utilize the Bollinger Bands to complement, or be complemented by, other technical indicators.
Reversals
This is a BBand-only strategy that relies on price action and proximity to the bands. When a price is at-or-near the upper band after having gapped or moved up sharply and then closes at or near its intraday low—a downward reveal may be forming. Similarly, when the price is at-or-near the lower band, having gapped or sharply moved downward, and then closes at-or-near the intraday high—an upward trend may be approaching.
Riding the Bands
In his book, Bollinger on Bollinger Bands, John Bollinger notes that “During an advance, walking the band is characterized by a series of tags of the upper band, usually accompanied by a number of days on which price closes outside the band” (Bollinger, 2001).
This results in an often sustained upward trend characterized by multiple tags of the upper band. A trader would be stopped out early if relying solely on upper band touches to signify sell signals. Considering the volume and relative band width can help avoid preemptive selling in such cases.
Bollinger Band Squeeze
During the development of Bollinger Bands, it became evident that the relative distance between the upper and lower bands was a powerful indicator of breakouts. This calculation became a standard feature of the Bollinger Bands and is used today to foreshadow large momentum swings.
The Bollinger Band Squeeze strategy signals a trade after a period of relatively tight bandwidth is observed. Then, following this period, a sharp increase or decrease in price is observed such that the close falls outside of the bands. Next, the price of the next few bars falls within the range of the bands. With these two setups, a potential breakout is then signified by the price action touching the band again.
Review
The utility of the Bollinger Bands is rarely disputed. The utility this indicator—all parts included—provides can be used in forex, securities, cryptocurrency, and even futures markets (Chen, 2018). Here we’ve seen the basics of how the Bollinger Bands are calculated and some brief introduction into how their values can be interpreted.
I cannot recall a single mention over of the Bollinger Bands in which this stark disclaimer was not included: don’t use them on their own to generate trade signals. Pairing with trendlines, other indicators, and a sharp awareness of volumetric and price action is essential. The Bollinger Bands offer a great insight into buying pressures of any market and can serve as a strong foundation of any algorithmic trading strategy.
The relative pricing data provided by the Bollinger Bands is similar to several other indicators. These include both the Mean Average Convergence Divergence (MACD) and the Stochastic Oscillators. Combined, these indicators can provide multiple levels of confirmation for generated signals—a strategy helpful in weeding out false signals resulting in woeful trade executions!
References
- Bollinger, John. Bollinger on Bollinger Bands. 1st ed., McGraw-Hill Education, 2001.
- Chen, Jing-Chao, et al. “Profitability of Simple Stationary Technical Trading Rules with High-Frequency Data of Chinese Index Futures.” Physica A: Statistical Mechanics and Its Applications, vol. 492, 2018, pp. 1664–78. Crossref, doi:10.1016/j.physa.2017.11.088.


