Percent error is a measure used to quantify the difference in an observed value compared to an expected value. Alternatively, it can be thought of as the measure of the difference between an experimental value and a theoretical value. It is used in science to describe the outcome of experiments observing natural phenomena or related simulations.
Percent error is sometimes referred to as approximation error which is descriptive of this formula’s intent. The main difference is that the Percent error provides results in a range of 0-100 (as a percent). An approximation error can also be reported as a relative error or absolute error. We’ll take a look at each of those later — for now let’s consider how to calculate percent error.
Percent Error Formula & Calculation
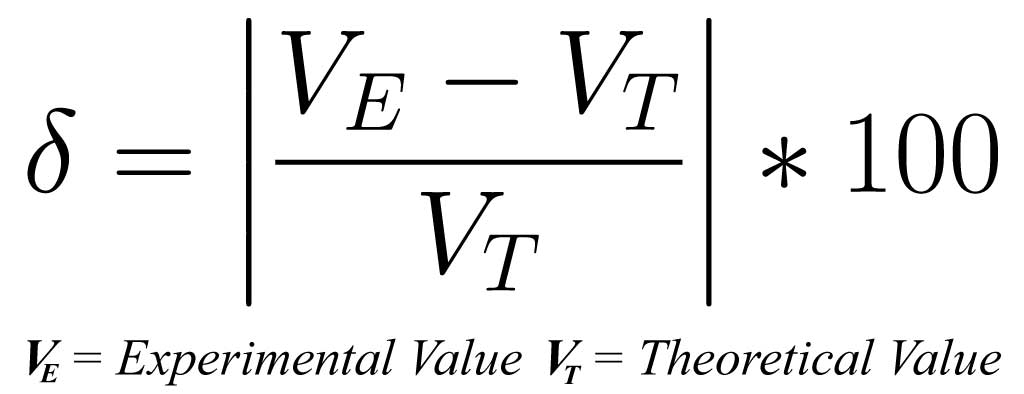
Percent error can be calculated in three easy steps in which two variable values are used. The steps are as follows1:
- Calculate the difference between the Experimental Value (VE) and the Theoretical Value (VT).
- Divide the value from #1 by the Theoretical Value (VT).
- Multiply the absolute value of the result of #2 by 100.
These three steps can be expressed via the following formula where the large vertical bars represent the absolute value (i.e. drop the sign) of steps #1 & #2 assigned to the variable delta (lowercase) as is common convention.
Absolute & Relative Error vs. Percent Error
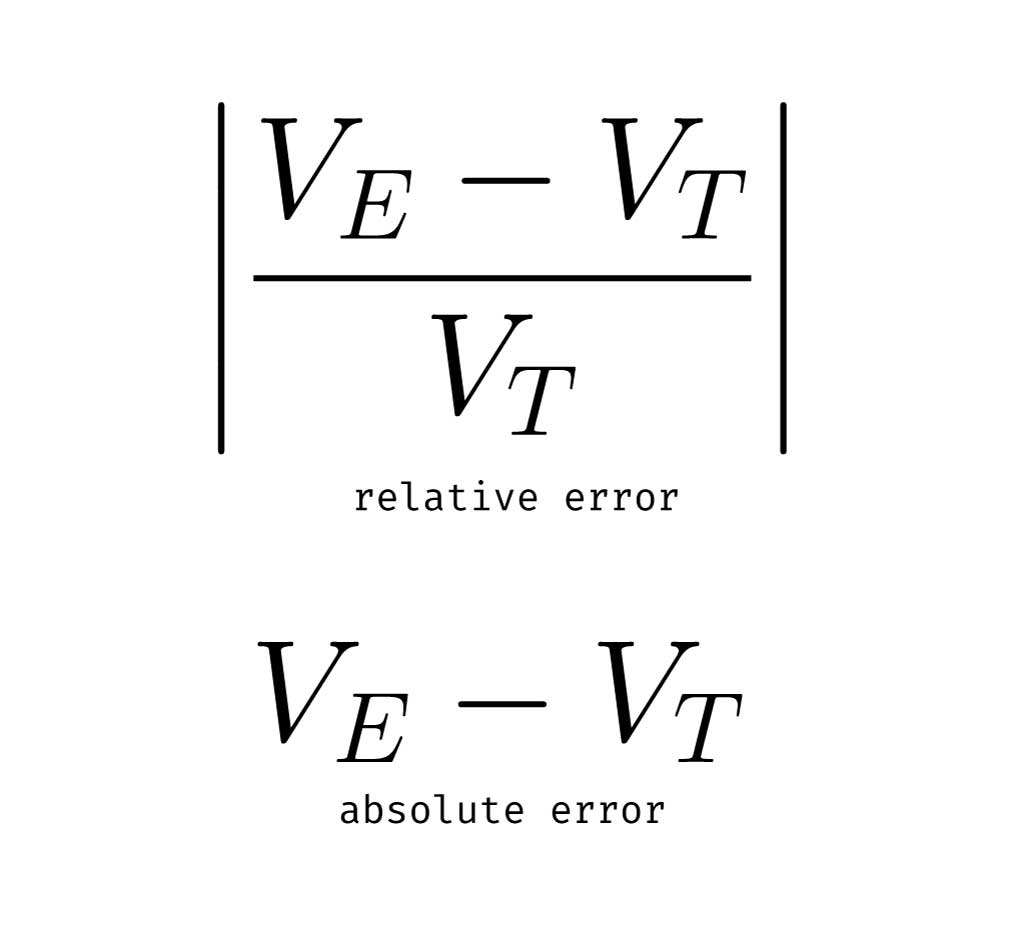
Absolute and relative error calculations are similar to percent error calculations but omit the multiplication of 100. As such, both of these calculations return decimal values. The absolute error omits the second step while the relative error goes through steps 1 and 2 as shown in the following figure:
Applications of Percent Error
Percent error is used to gauge the proximity of an unknown value to a known value. The vocabulary varies based on the field of study — sometimes “expected” is observed or inferred and “theoretical” is sometimes expected, known, or measured. These measures help researchers and scientists around the world describe the outcomes of observations in a contextual manner. The following are some possible examples of how percent error can be applied:
- The measure of the predicted values of a linear regression model vs the known values. Commonly applied as the Mean Average Percent Error (MAPE)2
- The density of deposits of rare-earth elements vs. pure forms
- The weight of a shipment of goods vs. the calculated weight based on the number of units ordered.
Context is Important
It is important to maintain awareness of context when using these measures — they can be presented in misleading ways. For example, a company reporting earnings might be an appropriate application for error calculations. Let’s say company XYZ forecast $300MM in earnings for Q1, but reported earnings are only $250MM. The following reflect the ways in which this miss can be quantified:
- Percent Error: |(250 – 300) / 300| * 100 = 16.66% miss
- Absolute Error: $50MM
- Relative Error: .016
There is not much confusion here, but consider comparing to another company ABC which missed their reported earnings of $65MM by $35MM. It could be reported that ABC missed its earnings by a smaller absolute amount — $30MM vs. $50MM. However, that’s a percent error of 46.16 which is much greater than the 16.66% realized by company XYZ.
Final Thoughts
Percent error is a useful measure to provide a relative comparison to a known value and a measured or observed value. In other words, a way to quantify how differently something was measured vs. how it was expected to be measured. The example outlined in the section on the importance of context illustrates how an understanding of what percent error represents is more fundamentally important than knowing how to calculate it.
Other calculations such as percent change (increase or decrease) can be used alongside the percent error to help bridge some contextual gaps. This measure, among many others, are valuable tools in the field of inferential statistics and is used by data scientists, researchers, mathematicians, and computer scientists across a wide range of applications.
References
- Tornqvist, L., Vartia, P., & Vartia, Y. O. (1985). How Should Relative Changes Be Measured? The American Statistician, 39(1), 43–46. doi: 10.2307/2683905
- Tayman, Jeff & Swanson, David. (1999). On the Validity of MAPE as a Measure of Population Forecast Accuracy. Population Research and Policy Review. 18. 299-322. doi: 10.1023/A:1006166418051


