The Python breakpoint() built-in function is a tool that allows developers to set points in code at which a debugger is called. By default, this function results in an instantiation of Python’s native debugger class. Since 3.7 however, developers can easily override this behavior and use the Python breakpoint() function to execute custom actions.
Debugging is an essential aspect of writing good code. This is true whether one is attempting to get initial logic operating, testing edge cases, or working to understand inherited code.
Python’s breakpoint() function can be used for all of the above. In this article, you’ll learn the basic syntax of using breakpoint(), the related call stack, an interesting environmental variable, and basic implementation guidelines. I’ll show how you can define a custom function to handle breakpoints also but won’t dive into too much technical detail.
TL;DR – The Python breakpoint() function calls Python’s debugger at a given line.
# Create a loop over 5 integers
for i in range(5):

    # Stream i to stdout
    print(i)

    # Create breakpoint at # 3
    if i == 3:
        breakpoint()

# Output
0
1
2
3
> c:\users\user\path\to\your\project\example.py(24)<module>()
-> for i in range(5):
(Pdb)
Quick History
Python’s breakpoint() built-in function was a new addition in version 3.7 via PEP553. The rationale behind adding the breakpoint() function touched on multiple points to better utilize the native pdp debugger and afford developers more flexible options. The main points of rationale were as follows:
- The previous syntax was clunky and overly verbose:
import pdb; pdb.set_trace(); - Limits debugging options to the
pdp; - Linters hate multiple statements in single lines.
PEP553 based its proposal for the new breakpoint() function on JavaScript’s js-debugger. Also of note, this PEP outlined new bindings to the sys module to provide added flexibility for breakpoint().
The most pertinent being the sys.breakpointhook() method. Additionally, PEP553 outlined the addition of a new environment variable named PYTHONBREAKPOINT to define custom debuggers, disable debugging, or resort to default behavior (pdp.) This article will only touch on these functions and variables minimally to illustrate the most basic use of the breakpoint() function.
Debugging 101: Using the Print Statement
Breakpoints are used to help developers identify and address problems in their code. These can be syntax errors, logical errors, runtime errors, compile-time errors, or anything in between. Breakpoints are integral to the process of debugging.
Python’s breakpoint() function provides a dynamic, easily customizable, and syntactically simple approach to debugging that uses the default pdp interactive debugger by default. Consider the following function:
def find_min(nums: [int]) -> int:
    """Finds the smallest integer value in a list"""
    smallest = 0
    for num in nums:
        if num < smallest:
            smallest = num
    return smallest
This function is designed to take a list of integers as an argument and return the smallest value. Given an argument of [9, 6, 3] the intended (maybe not expected if you’ve spotted the error already) behavior is to return 3. Let’s see what happens:
# Call the function to find the min
# value in a list of integers
>>> find_min([9, 6, 3])

0
Yikes. My function returned a value of 0 which was not intended (but expected!) Let’s pretend that the source of this bug isn’t clear—meaning we need to debug the code! Debugging often is done with little more than added print statements to stream a simple message to a system’s standard output (stdout.) In this case, we could do the following to try and narrow down the source of the issue:
def find_min(nums: [int]) -> int:
    """Finds the smallest integer value in a list"""
    smallest = 0
    for num in nums:

        print('num:', num, 'smallest:', smallest)
        if num < smallest:

            print('num smaller; re-assigning value:', num)
            smallest = num

    return smallest
We’ve now added two statements in our code that will print a message during each iteration of our loop that checks the smallest vs. num and upon num < smallest resulting True. Let’s see our output:
# Call the function with the
# same args as before
>>> find_min([9, 6, 3])

num: 9 smallest: 0
num: 6 smallest: 0
num: 3 smallest: 0
0
Note we now have three additional lines of output that detail the values of our variables. Also, note that the print statement in our if num < smallest: conditional is never displayed. This is our first hint at the nature of our code’s error. We can tell from this omission that no number in our list is ever being considered the lowest.
This is because our initial value for smallest is assigned a value of 0 which, in this case, is lower than any argument passed to our function! This test case results in undesired behavior and reflects a bug in our code. A fix would be to initialize the smallest variable with an infinitely large value like smallest = float('inf'). Let’s see that fix in action:
# Update the instantiation of smallest
def find_min(nums[int]) -> int:
    ...
    smallest = float('inf')
    ...

# Re-run the code
>>> find_min([9, 6, 3])

# Output
num: 9 smallest: inf
num smaller; re-assigning value: 9
num: 6 smallest: 9
num smaller; re-assigning value: 6
num: 3 smallest: 6
num smaller; re-assigning value: 3
3
As you can see here, each iteration in the resulting loop finds a smaller value. The sequence of events is now as such:
- 9 is smaller than infinity; replace the value of smallest;
- 6 is smaller than 9; replace the value of smallest;
- 3 is smaller than 6; replace the value of smallest;
- return smallest
This flow is reflected by the output to console via the print statements [still] embedded in our code. We’ve managed to find the issue, implement a solution, and confirmed our expected behavioral outcome.
However, we are now left with several print statements that should be removed from our code. In this case, two lines are no big deal—but imagine debugging a codebase with millions of lines of code spread across many loosely coupled modules, classes, and functions. Debugging via print statements could get troublesome quickly. Enter the interactive debugger.
Interactive Debuggers
Interactive debuggers allow developers to pause their code in real-time, “step into” specific lines, view variables in run-time dynamics, and provide a myriad of other features—none of which rely on print statements or additional code.
The Python Debugger provides developers with this utility out-of-the-box. Many elect to use the debugger provided by modern Integrated Development Environments (IDE) like PyCharm, Visual Studio, or **shudders** Eclipse. This out-of-the-box functionality is one reason Python has become such a popular programming language among such a wide range of developers.
Python’s pdp debugger has been available to developers for some time. Since 3.7 however, it can be more easily accessed via the breakpoint() function. This allows a simple call to a function to launch an interactive debugging session!
Let’s re-consider the bug we found in our code from above. This time, let’s use the breakpoint() function rather than print statements to deduce the problem!
def find_min(nums: [int]) -> int:
    """Finds the smallest integer value in a list"""

    # Instantiate initial smallest value
    smallest = 0

    # consider each number in arguments
    for num in nums:

        # compare to current smallest value
        breakpoint() # enter debug mode
        if num < smallest:

            # assign to smallest if value less
            smallest = num

    # return final value for smallest
    return smallest
Here I’ve added a call to the breakpoint() function just after we enter our loop that will consider each of the variables from our argument. This instructs Python to launch the default pdp debugger (more on how to control that decision later.) Re-launching our code results in the following output:
> c:\users\user\path\to\your\project\example.py(<line_number>)find_min()
 -> for num in nums:
 (Pdb)
This results in three lines of code: the first being a trace to the last stack frame caller, the second being the last next line in our code after the breakpoint() was called, and the third is a prompt indicating we are now in an interactive session with the pdp debugger.
This is regarded as a command-prompt context in which developers can enter valid pdp commands to gain insight into their code. I’m won’t go into depth on pdp commands here and will only use the n command to ‘step into’ the next line and the num and smallest commands to display the current values of those variables. Let’s see the results of launching breakpoint() in action:
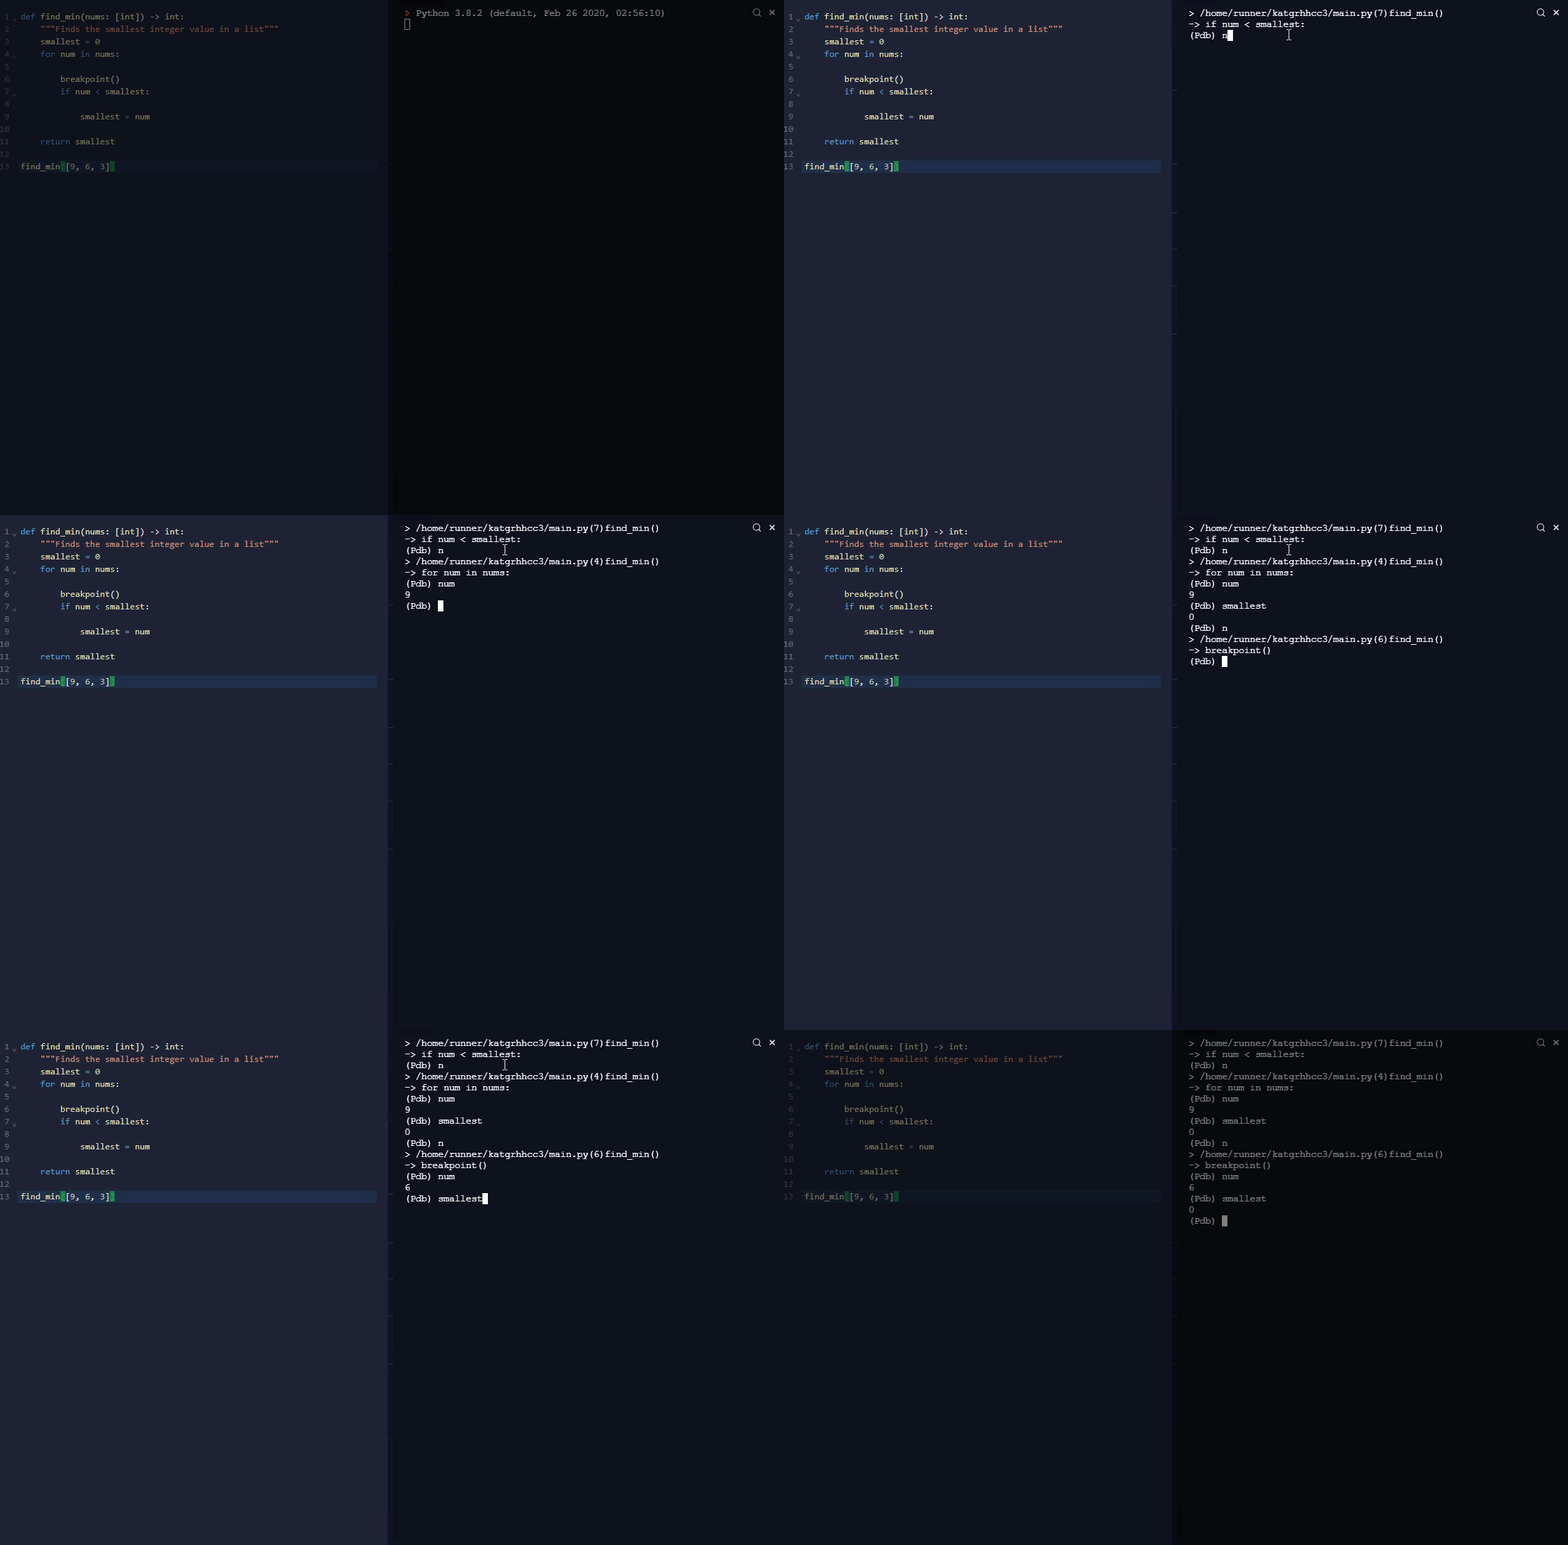
As you can [hopefully] see in this series of actions, the breakpoint() function launches an instance of the pdp interactive debugger that prompts for commands. Using the n command instructs the pdp to execute the next line of code.
By typing num and smallest I am able to view the current values of those variables. Through a series of n, num, and smallest commands we can see that the value of smallest isn’t changing and that initializing it with a value of 0 was a logical error.
One obvious advantage is this approach allowed us to debug the function with much less added code—a single breakpoint() statement vs. multiple print statements. With customization, we can even handle breakpoint() behavior to sidestep having to remove that code later (removal still advisable though.)
Advanced Usage
Python’s breakpoint() function can be used without arguments as a standalone call that results in the behavior we’ve seen so far. Namely, a no-fuss instantiation of Python’s native interactive debugger. Breakpoint requires no arguments but will pass any arguments to Python’s sys.breakpointhook() for interpretation.
This is great for out-of-the-box behavior, but not great for developers that prefer other debuggers. For example, one might want to integrate with a remote debugger like PyCharm or Web-PDP. See this StackOverflow post for considerations there. I won’t be going into that much depth here.
To demonstrate simpler customization with breakpoint() we’ll create a custom function to replace the call to the pdp debugger. There are three moving parts to this puzzle to be aware of before we get started:
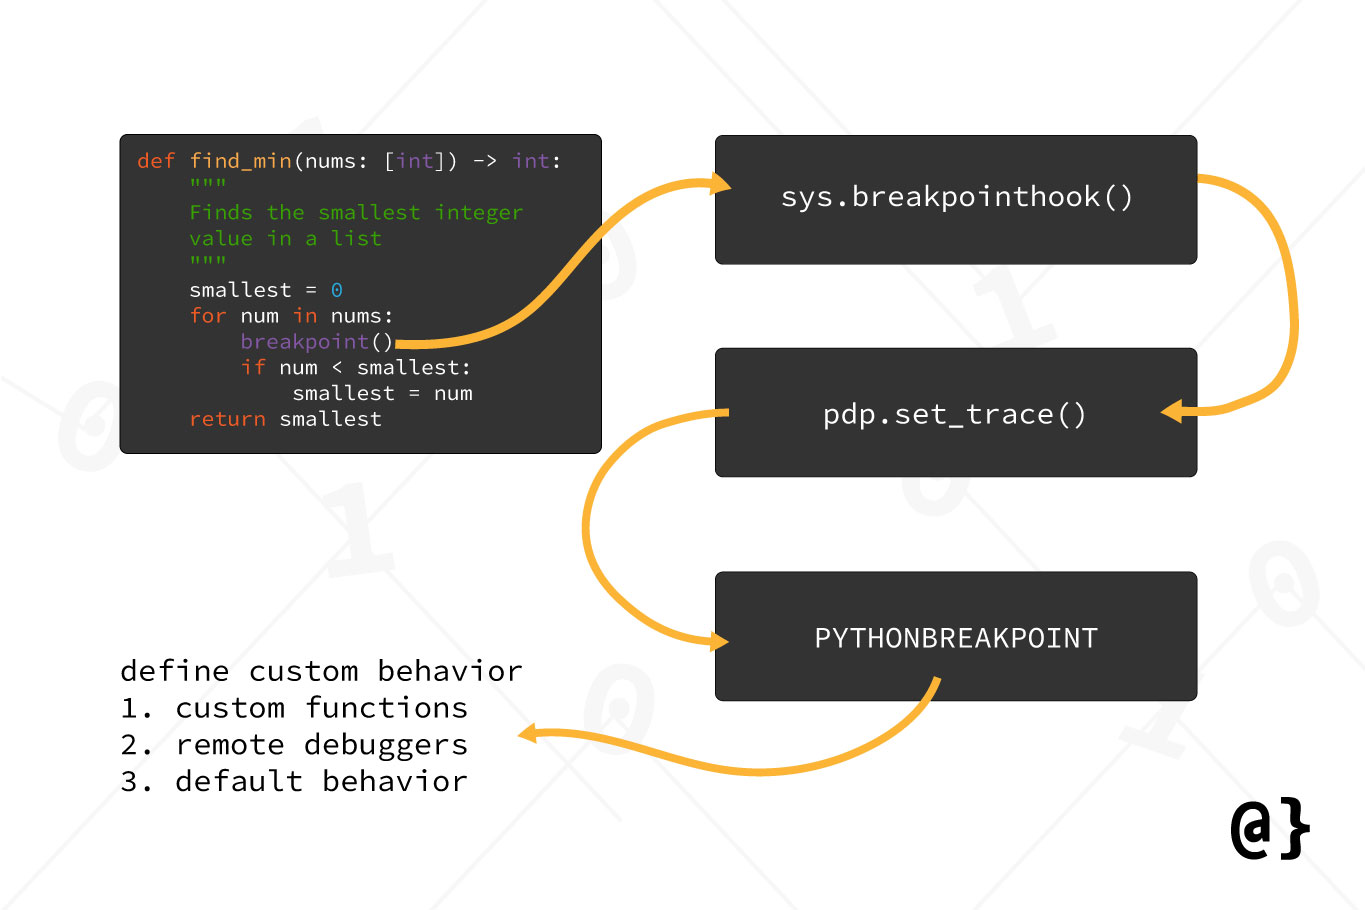
The breakpoint() function calls sys.breakpointhook() and which is just a wrapper for pdp.set_trace() which then consults the PYTHONBREAKPOINT environment variable. This variable dictates the type of action to be taken with respect to debugger choice (or custom function to be called.) If PYTHONBREAKPOINT is not specified, the pdp debugger will launch by default. Let’s consider this interplay visually:
To illustrate a basic example of customized breakpoint() behavior, I’m going to create a custom function that simply prints some information to the console. This will be a step backward in functionality from what the pdp debugger offered but a step forwards in functionality from our original approach of using print statements. It’ll be a nice little compromise.
import os

# Customize env variable value
os.environ['PYTHONBREAKPOINT'] = 'examples.breakpoint.bp_handler'


def bp_handler(message: str) -> None:
    """A custom handler for breakpoint()"""
    print(message)


def find_min(nums: [int]) -> int:
    """Finds the smallest integer value in a list"""
    smallest = 0
    for num in nums:
        breakpoint(f'Num: {num} Smallest: {smallest}')
        if num < smallest:
            smallest = num
    return smallest


if __name__ == '__main__':
    find_min([9, 6, 3])
In the above code, I have told pdp.set_trace() to use the bp_handler function via setting the value of the PYTHONBREAKPOINT environment variable. In the find_min function, I’ve passed a string message to the breakpoint() function, which is passed to the sys.breakpointhook() call, which is passed to the pdp.set_trace() which, ultimately Is passed to the bp_handler() function and gets streamed to stdout. This is all wrapped up in the if __name__ == '__main__': syntax and results in the following output:
Num: 9 Smallest: 0
Num: 6 Smallest: 0
Num: 3 Smallest: 0
This prints out a message detailing the current state of our program via a description of the num and smallest values. Note that virtually any functionality can be implemented in this manner. As an added bonus; all one needs to do to stop the debugging info from appearing on the console is to set the value of PYTHONBREAKPOINT to ‘0’.
This causes the sys.breakpointhook() function (upon being called by breakpoint()) to return immediately. This removes the immediate need to remove any breakpoint() statements from our code! Control and Convenience—I love it.
Note: The value of PYTHONBREAKPOINT must be a string. i.e. “0” (the char) not 0 (the int literal.)
Final Thoughts
Python’s breakpoint() function has afforded developers a much more robust standard debugging pipeline than previous releases. While the Python debugger is nothing new, the breakpoint() builtin, along with the PYTHONBREAKPOINT and sys.breakpointhook() additions provide better control and convenience.
The examples in this article are of the most basic form. Advanced usage and integration with complex workflows and pipelines are certainly possible. Personally, I don’t find myself using breakpoint() it very often and prefer to use a combination of PyCharm’s interactive debugger and the Python logging module. Between the two of these, I find I can usually rundown any bugs.


