The stochastic oscillator is a momentum indicator that is used to indicate overbought or oversold status. It has remained one of the most popular technical indicators in stock trading since its conception in the 1950s. Today, the stochastic oscillator is popular mainly because of its simplicity of interpretation and high accuracy.
The stochastic oscillator is similar to moving averages in that takes into account a number of previous trading periods. As an indicator, it signals a potential trend reversal. This signaling can be used to help time entry/exits with shifts in price momentum.
Stochastic Oscillator Anatomy
The stochastic oscillator has several values that are used in tandem to provide actionable insight. Some of these are fixed ranges while others are adjustable based on analyst specifications. Consider the following illustration:
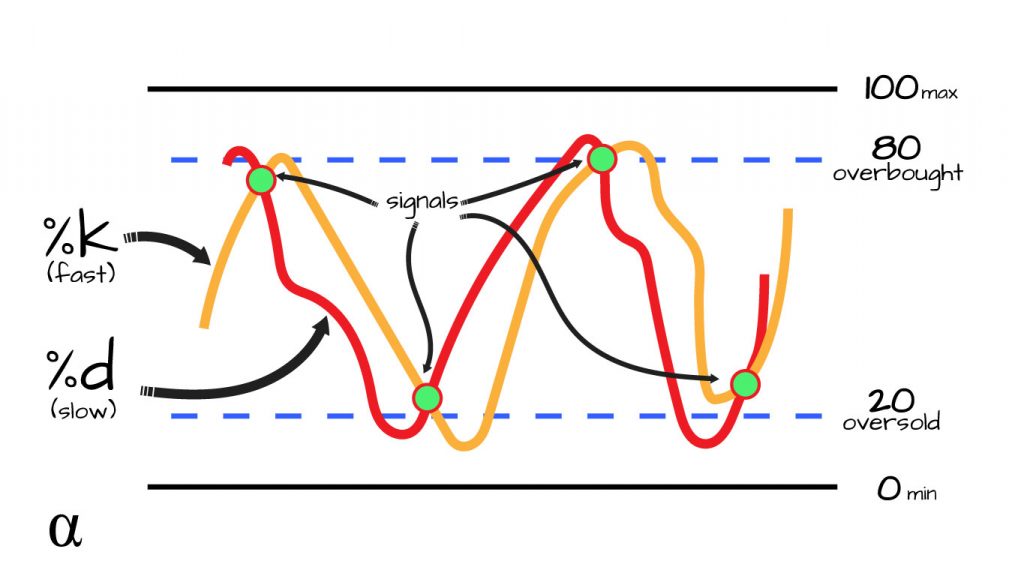
To understand these moving parts, it’s important to realize that the Stochastic Oscillator provides calculations on a range of 0-100. Threshold lines are set (typically at 20 and 80) to indicate overbought or oversold status. Below are the main parts of the stochastic oscillator:
- %K (a.k.a Fast Stochastic) – A calculated number for the most recent value relative to the highest and lowest values over the lookback period.
- Lookback Period – The number of previous periods for which the k value is calculated; typically 14 previous periods.
- %D (a.k.a. Slow Stochastic) – A trailing momentum indicator relative to the k-values to smooth out trendlines and used to generate trade signals. Uses K values to generate a Simple Moving Average (SMA); commonly 3 periods in length.
- Overbought Line – The threshold at which the SO indicates an overall bullish market trend. Typically set at 80 but also commonly set to 70.
- Oversold line – The threshold at which the SO indicates an overall bearish market trend. Typically set at 20 but also commonly set to 30.
- Min/Max Lines – The top and bottom of the SO chart reflecting the 0-100 range of possible values for the SO.
Fast vs. Slow Stochastics
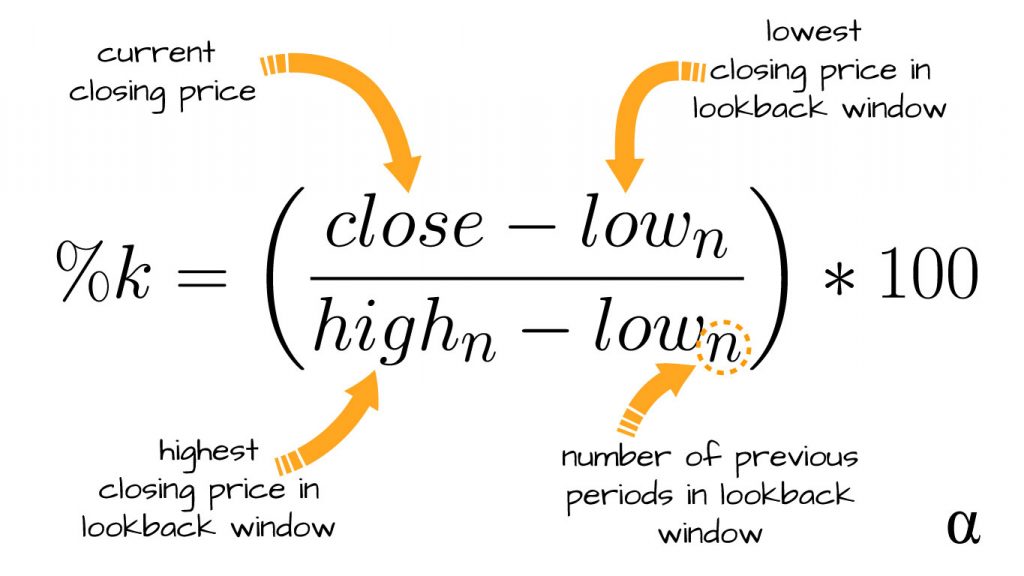
The %k value represents the most recent value relative to the highest and lowest observed values during the lookback window. This number reflects a percentage total of the highest possible value during that range and is calculated as such:
The %d value represents a smoothed out version of the %k, averaged out over a shorter lookback period—commonly 3 periods in length. This signal is a simple moving average (SMA) of the %k and represents a slightly slower-to-react reflection of the relative price over the longer lookback period.
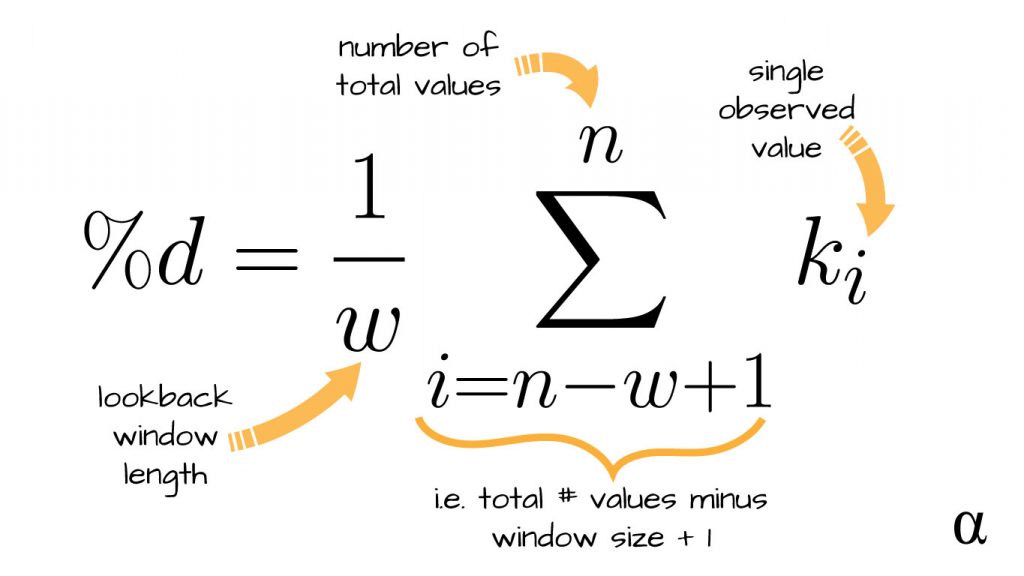
The main difference in the slow stochastic signal is that it is calculated based on the %k signal rather than closing prices. In this sense, it is a less direct measure of price momentum and more an interpolated version of that momentum—if we’re splitting hairs.
Interpreting the Stochastic Oscillator
The stochastic oscillator, much like other price momentum oscillators such as RSI, provides insight to price momentum changes. In trading, the SO is based on the observation that prices tend to close near the daily high trading price during bullish markets and near the daily lows during bearish markets. More generally, the SO can be interpreted as a measure describing a price’s tendency to close near its previous high or low over a fixed period (lookback).
The %k and %d values are called signal lines and indicate price momentum. When these lines cross it is considered an indicator of a shift in price momentum. The SO signals a possible upwards momentum shift if these signals cross when they are near the 20 (oversold) threshold. Likewise, the SO signals a possible downward trend if these signals cross when they are near the 80 (oversold) threshold line. Let’s take a look at some examples:
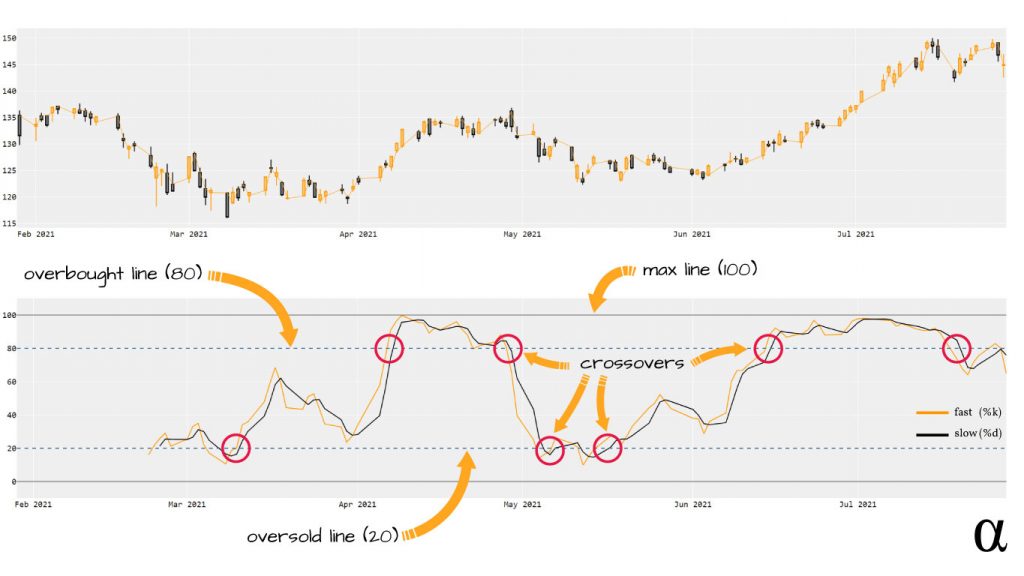
As we can see in the above diagram, the interplay of the signal lines of the Stochastic Oscillator is essential to its interpretation. The crossover points (circled in red) illustrate where the fast signal line crosses over the slow-moving line. This often signals a momentum shift in observed values.
In trading, these signals are often used to time entries and exits. A word of warning; the stochastic oscillator can produce many false signals during volatile markets. Combining with other indicators, such as long-term moving averages, can help offer greater support in signal accuracy.
Signals such as the stochastic oscillator can be incorporated in more advanced statistical analysis such as linear regression modeling. These indicators—referred to as features in the context of machine learning—can offer the powerful predictive ability to these modern statistical models. Check out the article Predicting Stock Prices with Linear Regression in Python for some examples of how these models can be applied quickly—even by novice programmers.
History
The Stochastic Oscillator was developed by Dr. George Lane in the 1950s as a product of studying the relationship between current pricing and recent high and low pricing. Dr. Lane has been quoted as describing the stochastic oscillator as such (Pruitt, 2016):
“It doesn’t follow price, it doesn’t follow volume or anything like that. It follows the speed or the momentum of price. As a rule, the momentum changes direction before price.”
Lane’s development of the Stochastic Oscillator was based on the perspective that momentum changes faster than volume or price action. Today, this helps traders identify trend reversals by looking for signals of shifting price momentums.
Final Thoughts
The stochastic oscillator is a useful technical indicator in identifying shifts in observed values over periods of time. These shifts, reflecting the momentum of change in recent values, are very utilized in stock market trading. The Stochastic Oscillator can help identify reversals in market trends and provides insight into the best entry/exit timings.
References
- Pruitt, George. The Ultimate Algorithmic Trading System Toolbox + Website (Wiley Trading). 1st ed., Wiley, 2016.


