The mean, often called the average, is a mathematical concept instrumental within statistics and data science. It is a method used to describe the central tendency of a set of discrete data (list of numbers) commonly used along with the median and mode.
While the mean is taught as a simple concept in schools worldwide, there’s actually a lot more to it than most people are aware of. The mean can be calculated in several ways and, as such, has several different conditions in which it may be more (or less) useful.
Regardless of the approach, the mean is one of several statistical measures of central tendency. These measures are used to describe the middle or center point of a set of data.
Types of Mean Calculations
There are more than a few different approaches for calculating the mean. The “common” method of adding all numbers together and dividing by the total is the arithmetic mean—the one taught in most common math classes.
In addition, there are such approaches as the power, truncated, Fréchet, weighted arithmetic, and more than a dozen more types of mean calculations. Some are more domain-specific, such as the moving average (used in stock analysis) but they all offer some description means of data centrality.
The most popular types of the mean are the Pythagorean means: arithmetic (AM), geometric (GM), and harmonic (HM) means. These were developed by Pythagoras and later evolved by Greek mathematicians partly due to their broad applicability to numbers, geometry, and music.
Arithmetic Mean
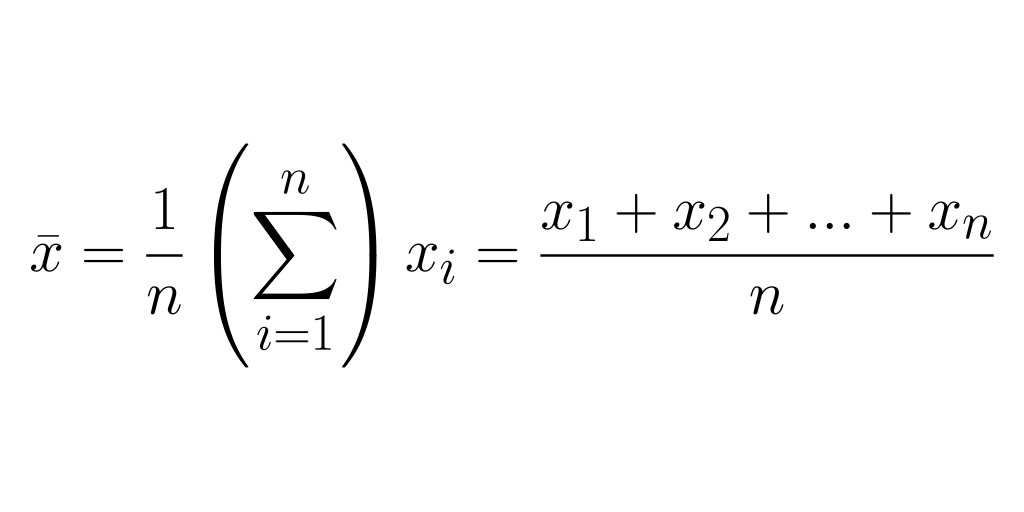
The arithmetic mean is calculated by summing all discrete values in a set and dividing that number by the total number of values. This value, sometimes called the expected value, is considered representative of the central tendency of a collection of numbers.
In the context of statistical sampling, the arithmetic mean is referred to as the sample mean (a.k.a. x-bar) to denote it describes a subset of values within a larger population.
For example, the arithmetic mean (average) of a collection of 50 values maybe 100. However, a randomly selected sample population of 10 values from that collection may have an arithmetic mean value of 75.
This is when the term sample mean is used—the mean of a sample of values from a larger set. The sample mean can be used as an estimator in cases where population parameter values are incalculable directly. Consider the illustration below:
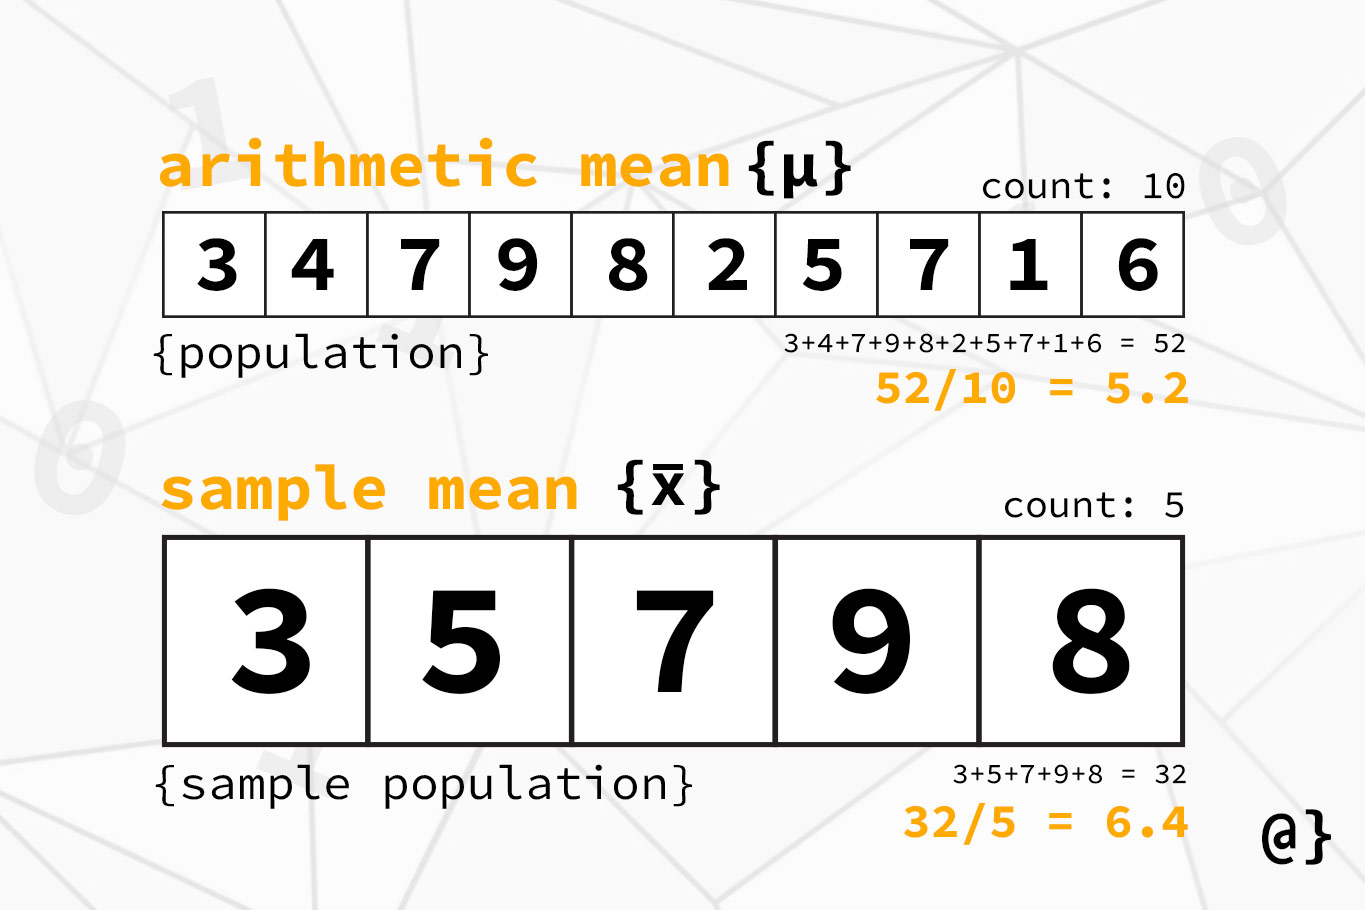
The terms mean, average, and arithmetic mean are synonymous. Depending on the context, these terms may be used interchangeably or exclusively. For example, the most common discussions in daily life use the term average: a batting average, average temperature, and average household income. More technical discussions may rely solely on the term mean or sample mean to convey meaning. When choosing such vocabulary it pays to first read the room!
Geometric Mean
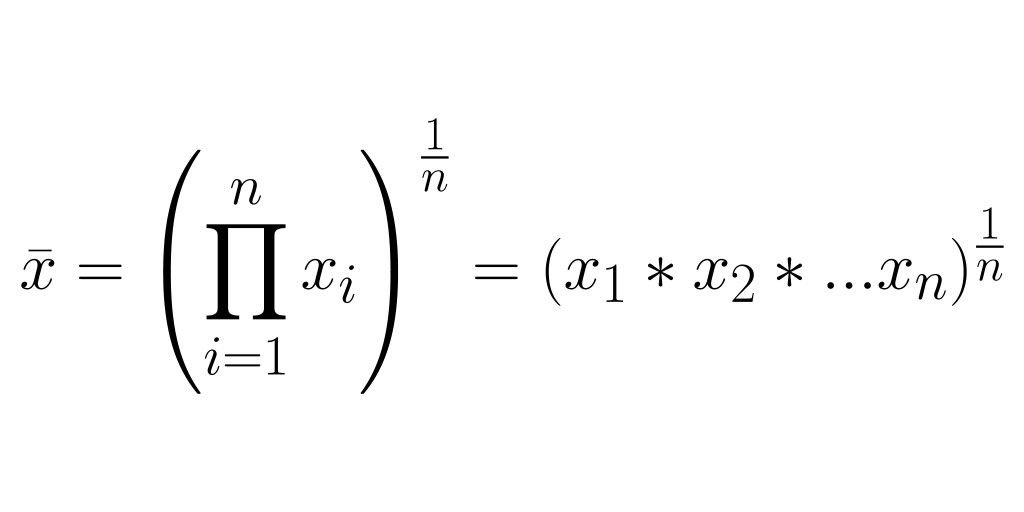
The geometric mean is an average value calculated by multiplying all discrete values within a population, then taking the n-th root of that value—where n is the total number of values.
The geometric mean is useful when trying to condense comparisons into a spatially-aware domain. For example, the geometric mean of a [4, 9] ( 4 * 8 = 32 ) is the equivalent of a 9 x 9 square.
The geometric mean is also very useful in comparing The illustration below provides a more visual representation:

The geometric mean is useful when comparing things that are very different in nature but share a similar unit of measurement, like diameter. For example, one could take the geometric mean of a cell and the Earth.
The geometric mean is also useful when comparing compound values of objects with properties with values in very different ranges. For example, consider the following graphics cards’ based on total CUDA cores and average user review:
EVGA GeForce RTX 3080 XC3 ULTRA GAMING: Average Rating: 4.8; CUDA Cores: 8704
MSI – NVIDIA GeForce RTX 3070 VENTUS 3X: Average Rating: 4.8; CUDA Cores: 5888
Comparing these two cards’ specs + ratings with the arithmetic mean would result in numbers with a fairly large disparity: 4354 vs. 2946. However, using the Geometric mean for comparison results in a much closer range of 204 and 168.
Consider the table below:
| EVGA RTX 3080 | MSI RTX 3070 | |
|---|---|---|
| Rating | 4.8 | 4.8 |
| A.Mean | 4354.4 | 2946.4 |
| G.Mean | 204.3996 | 168.1142 |
There’s no assurance these values provide any practical comparison but the geometric average provides a more evenly distributed assignment of relative weights between values. In simple terms; it allows the rating value of 4.8 to have much more influence than when calculated with the arithmetic mean.
Harmonic Mean
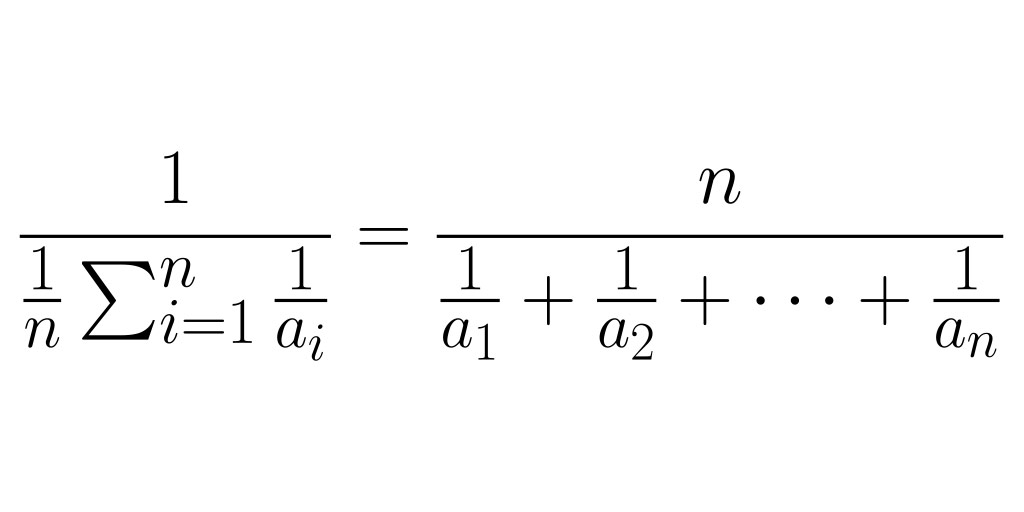
The harmonic mean is calculated by taking the reciprocal value (inverse) of the average of the reciprocal values of a set of numbers. Yes, this can be confusing but it’s actually quite simple once one understands what’s going on.
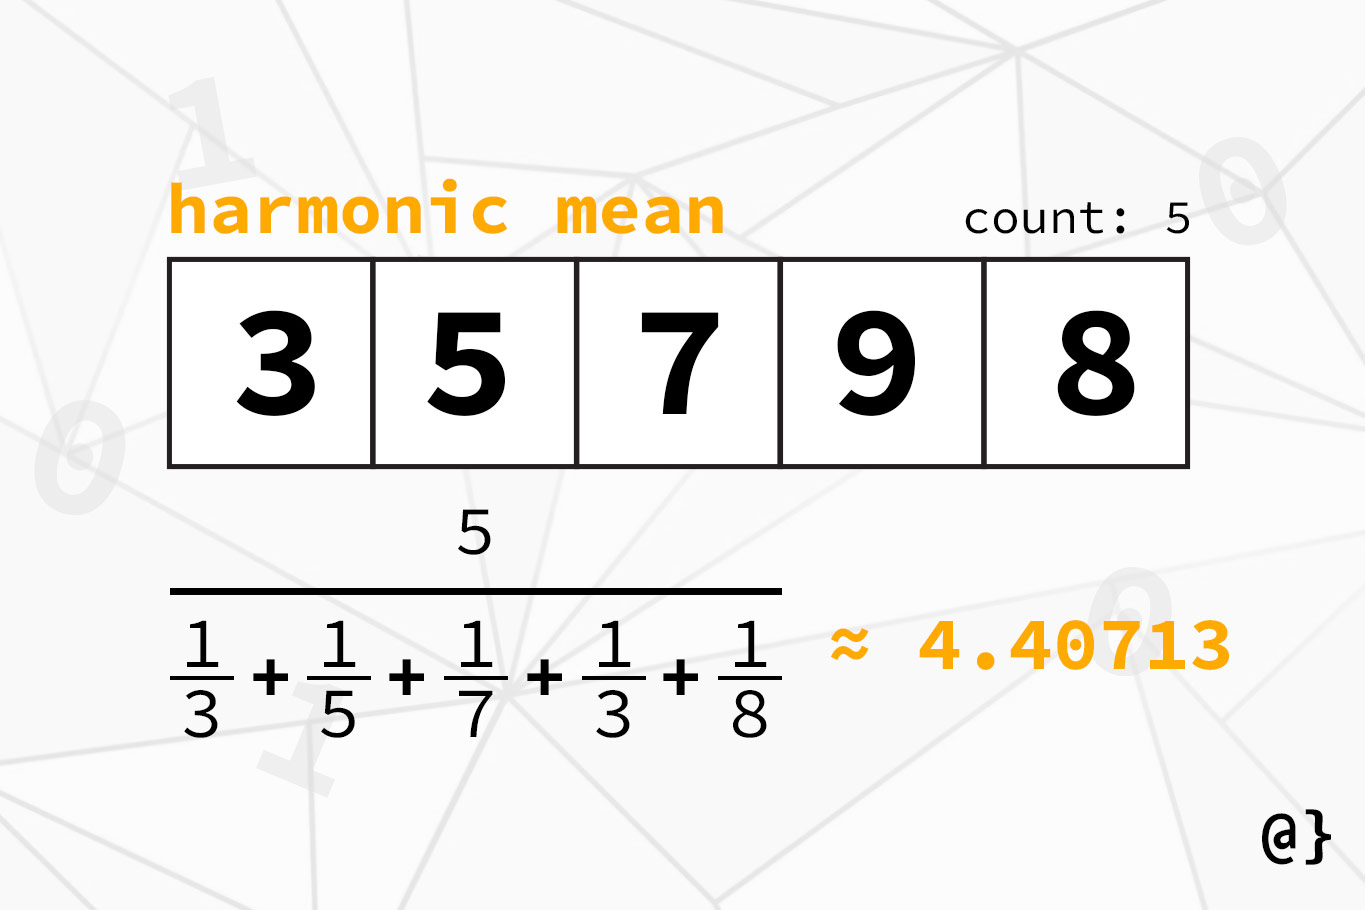
The harmonic mean, much like the geometric mean, is a multiplicative (inverse multiplication is a division) that can be useful when comparing values and/or fractions with different denominator values. This avoids all that pesky mucking about to find a common denominator. Consider the following illustration:
The canonical example of harmonic mean applications is for traveling—distance divided by time. Consider a person taking a trip by train from point A to point B and then back to point A: the initial leg of the trip, point A to Point B has an average speed of 60mph. However, due to nasty weather conditions, the return trip, from point B to point A, has an average speed of 15 mph.
It takes much more time to travel during the second leg of the trip but that experience isn’t necessarily reflected by the arithmetic mean value of 60 +15 / 2 = 37.5. If one wanted to describe the average speed traveled during the trip, the value of 2 / 1/ 60 + 1 / 15 = 24 is much more illustrative of the longer time spent traveling at 15mph throughout the trip than the rate of 60 mph.
Final Thoughts
The “average” value of any set of numbers is often a misleading term—though typically it means the arithmetic mean. The three common types of means discussed here illustrate how different applications can benefit from a bit more consideration than simply adding numbers and dividing by the total count.
Sure—the arithmetic mean has plenty of well-suited applications. Knowing the advantages of geometric and harmonic mean calculation can still help spot possible avenues for more contextually aware calculations.


