Moving averages are calculations that estimate an average for a subset of values within a larger series of data. They are highly utilized in the technical analysis of stocks and finance to identify upward and downward price movements. Generally, moving averages are a way of removing noise from time-series data.
The simple moving average (SMA), exponential moving average (EMA), and weighted moving average (WMA) are common indicators used in technical analysis. These statistical indicators may be used in isolation, together, or combined with other indicators such as the Moving Average Convergence Divergence (MACD). More broadly, these indicators are considered momentum indicators.
Calculating Moving Averages
Each moving average is calculated by taking into consideration a window of previous values. This window can be of any length but common values are 100, 200, and 250 for the SMA and 5, 10, and 20 for the exponential moving average EMA. These values help smooth out pricing trends and are used to help identify price reversals and emerging trends. Below is an illustration of how a 5-day simple moving average would be calculated:
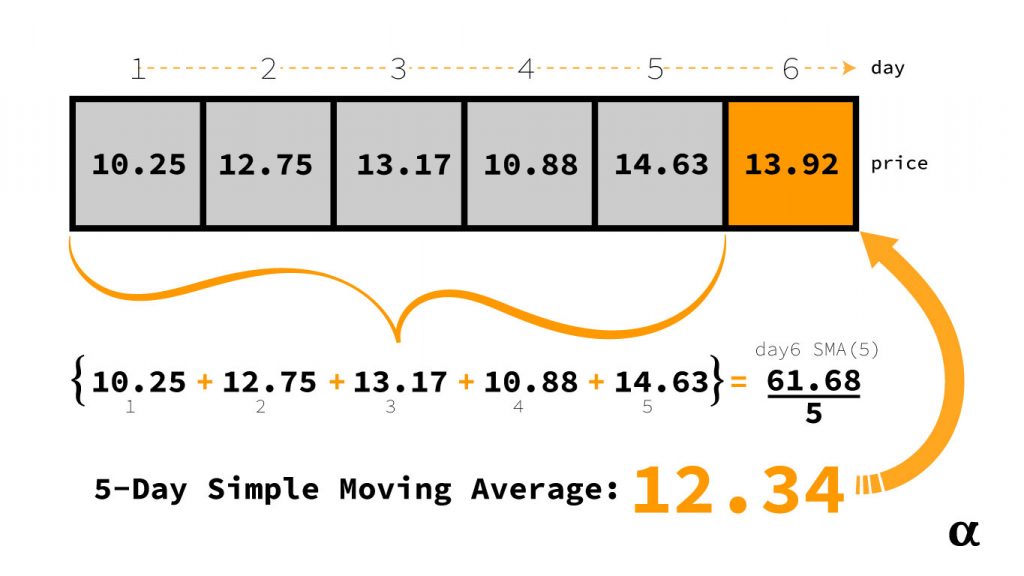
In this illustration, the 5-Day SMA for Day 6 is calculated by adding the price history of the previous 5 days and dividing by 5: ($10.25 + $12.75 + $13.17 + $10.88 + $14.63) which results in an SMA or $12.34—lower than the current day price of $13.92. This calculation could be interpreted as an indicator of an uptrend in price.
Moving averages can account for any number of numeric values. Common values for moving averages used as technical indicators for stock trading include:
- Closing or Opening Price
- Daily High or Low
- 52-Week High or Low
- Volume
Moving averages can also be calculated for composite values or even included as an engineered feature in more advanced analytical methods like linear regression. Calculating moving averages is a straightforward statistical task. Interpreting them to draw meaningful conclusions or develop profitable trading strategies is more akin to an art form.
Interpreting Moving Averages
Measures of moving averages are often visualized as overlays on stock pricing charts. Indicators such as the SMA, EMA, and WMA are useful to identify reversals in upward or downward movements. Moving averages are often visualized as trendlines overlayed regular pricing charts.
When the trendline of a moving average crosses over the price it can be an indicator of reversal. Consider the pricing chart for $NVDA during the 9/1/2019-10/1/2019 period where two SMA/Price crossovers were observed:

This chart reflects three crossovers between SMA and price—each of which was during a notable shift in price momentum. This chart also illustrates the lagging nature of moving averages such that the crossovers were observed after the momentum began to shift. In this case, the SMA is good at confirming a momentum change but not at predicting one.
Moving averages are calculated across periods—these can be years, months, days, minutes, or even seconds. The only requirement in the conventional moving average calculation such as EMA, SMA, or WMA is that the periods be of the same unitary measure. In other words, you can’t mix days with weeks! Let’s consider some of the different types of moving averages and the benefits of some common periods used for them.
Types of Moving Averages
There are several common types of moving averages used as technical indicators for trading. These include the SMA, EMA, and WMA. There are other less common moving averages such as the linear smoothed moving average (LSMA) but we’ll limit our discussion here to the three most common: SMA, EMA, and WMA.
These moving averages can be adjusted for different windows, combined, or used as part of more complex indicators such as the Bollinger Bands or the MACD. Moving averages can also bolster additional support for other indicators such as the Relative Strength Index (RSI). Below is a brief overview of common window specifications and benefits of each of the three most common moving averages.
Simple Moving Average (SMA)

The simple moving average is the most common moving average indicator used in technical analysis. It takes the values of n-many previous periods divided by that number of periods (e.g. the sum of 5 days price history divided by 5 for a 5-day moving average.) The SMA is also sometimes referred to as the single moving average.
In technical analysis, the 5-day SMA is calculated by averaging the previous 5-days’ price. This can be done for the open, close, or any intraday measure a trader chooses. Common SMA windows include 50, 100, and 200-day periods.
50-Day SMA
This is arguably the most popular variety of the SMA and is used as a key level for stocks and index charts. This period can be applied to help keep one in a stock seeing continued growth such that momentary dips don’t trigger trailing stops (or panic sells.) This indicator is often used with a short-period EMA such as the 10-Day to confirm pricing positions. Breakouts can often be signaled when 10-day EMA moves upward when pricing is already above the 50-day SMA. In long positions, the 5-Day SMA can signal entry/exit points to ensure maximum profits.
100-Day SMA
The 100-day SMA is often used as an indicator to signal dip-buying opportunities. For long positions, the 100-day SMA can be used to stop out and allow for re-entry once the price closes above the 100-day SMA again. This signal can be combined with others such as Bollinger Bands to offer greater support. For instance, when crossing the lower band 20-band of the Bollinger Bands the SMA-100 can indicate a long-term trend reversal and the beginning of a bullish trend.
200-Day SMA
The 200-Day SMA is a long-term trendline often interpreted as the last indicator of key support for bullish trends and regarded as one of the most popular indicators among any market. Swing trading strategies often use the 200-day SMA to time entry/exit positions—where a price drop below the 200-day line signals a sell and price lines crossing over the 200-day SMA signal to buy.
Weighted Moving Average (WMA)

The weighted moving average is similar to the SMA but considers each previous value with a different priority. For example, the oldest value may contribute least to the final calculation—interpreted as signaling the most recent price as being the most influential. Weighted moving averages allow analysts to create custom weighting strategies that can be non-linear in distribution. In other words, if the most recent value is weighted with the most priority the oldest value isn’t required to be weighed with the least priority.
Exponential Moving Average (EMA)

The exponential moving average is a type of weighted moving average that assigns a fixed series of exponentially decreasing weights to previous values. The EMA offers a more pronounced indicator that better reflects recent price action. This signal can help signal optimal entry and exit points for trading stocks. The EMA is sometimes referred to as the exponentially weighted moving average (EWMA) considering it is similar to the WMA with a pre-defined weighting convention.
5-Day EMA
The 5-Day EMA is regarded as a short-term trend signal and responds quickly to price shifts. The 5-Day EMA can indicate a short-term down-turn when the price suddenly falls beneath after several weeks of trading above. Likewise, the price suddenly breaking above the 5-day EMA can indicate an upward trend. The 5-day EMA is also useful as an end-of-day signal in combination with longer-term indicators to help signal emerging trends. The 5-day EMA offers stronger signaling when used in conjunction with other signals indicating a strong bullish trend, such as the 200-day SMA.
10-Day EMA
Long-term trends can be signaled with the 10-day EMA is combined with the 50-day EMA. This moving average becomes less useful during periods of more extreme volatility and can cause pre-mature stop-loss exits if not counterbalanced. The combination of the 10-day and 50-day EMA indicators smooths out a lot of the noise present when either is used separately. Further support for the 10-day EMA can be afforded by trading on the positive side of longer-term trends such as the 200-day or 100-day SMA.
20-Day EMA
The 20-day EMA is useful in signaling intermediate trends and can be useful in helping to avoid early stop-outs during short-term dips. For example, if a price drops below the 10-day EMA—but remains above the 50-day EMA—that might signal the dip as being only temporary. The 5 and 20-day EMAs are often used in combination to signal entry/exit points for intermediate trends and are also further strengthened in combination with oversold or overbought indicators such as the RSI.
Further Reading
The use of moving averages varies wildly among traders. The periods listed here are but a handful of those used to predict market trends. I suggest any reader interested in learning more about moving averages in trading read the book Moving Averages 101 by Steve Burns. It offers a 100-page crash course on integrating momentum indicators into one’s trading strategy.
Review
Moving averages are powerful indicators of momentum shifts in time series data. They are among the most common technical indicators used for stock analysis and can help identify entry/exit points, signal a market shift, and predict the end of bear and bull markets.
Here we have discussed the exponential moving average, simple moving average, and more general weighted moving averages. While these are the most common moving average indicators there are still plenty more out there. Playing around with different weights for the WMA alone can generate an infinite number of variations!
Modern analytical tools like Python, Pandas and some statistics libraries offer easy implementation of these types of indicators. With a few lines of code, one can easily calculate the moving averages for hundreds of stocks in almost real-time. Check out the article on how to calculate moving averages in Python for a quick tutorial.


