The Moving Average Convergence Divergence is a momentum indicator that describes shifts in values over several periods of time-series data. It is among the most popular technical indicators used by stock analysts and helps identify shifts in market trends, momentum, and possible breakouts.
The Moving Average Convergence Divergence (MACD) is made of several distinct exponential moving averages (EMA) calculations made across different periods of observation. This produces the MACD line, the Signal Line, and a value signifying the Convergence/Divergence between them. These values are often visualized as a chart of two signal lines plotted to overlay a histogram.
Highlights
- The MACD is an absolute price oscillator used to predict market momentum, price shifts, and potential breakouts.
- The MACD is calculated by a series of exponential moving average calculations using several common periods of observation.
- The MACD can be interpreted in many different ways, each using the MACD line, the signal line, and the histogram values differently.
- The MACD can produce many false signals during periods of high market volatility.
- Crossovers, zero crossovers, and histogram reversals are some of the signals generated by the MACD that can help inform trading decisions.
What is the MACD
An absolute price oscillator (APO) reflects value changes of price changes over a period of time. APO oscillators are contrasted with percentage price oscillators (PPO) indicators like the Stochastic Oscillator that reflect a percentage change over a period of time.
APO indicators like the MACD are utilized for comparing price changes within a single stock whereas PPOs like the Stochastic Oscillator can be used to compare prices between multiple assets or assets with different unitary measures.
The MACD is considered a momentum indicator and for the most part, is interpreted as a lagging indicator. However, some aspects of the MACD can be used as leading signals to help predict future shifts in the market—more on that below.
The MACD generates several signals that can be interpreted to signify momentum changes, trend reversals, and overall market strength. The MACD is visualized with two signal lines and a histogram chart.
In shorthand, the MACD is often represented with respect to these components as MACD(fast, slow, histogram) where each of the arguments are periods of time over which the calculations are made. For a clear picture of how the MACD is interpreted let’s consider how to calculate each of its key components.
Calculating the MACD
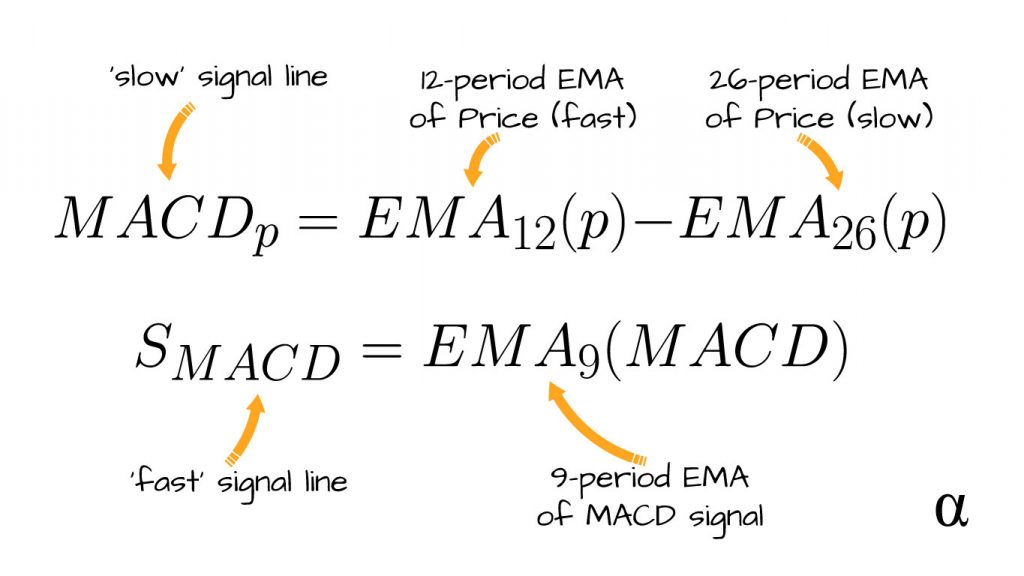
The MACD uses moving averages to generate the three primary components. More specifically, the MACD uses three exponential moving averages (EMA) calculations:
- 12-Period EMA
- 26 Period EMA
- 9-Period EMA
The 12 and 26 periods EMA’s are used to generate the MACD line. This calculation is done by taking the difference between the 12-period (fast) EMA of the price and the 26-period (slow) EMA of the price. The 9-Period EMA is then generated using these calculated values and represents the convergence/divergence amount reflected in the histogram (Appel, 2005). Below are the different calculations:
- MACD Line: 12-Period EMA – 26 EMA
- Signal Line: 9 EMA of MACD
- Histogram: MACD – Signal Line
The terms fast and slow are often used to describe various aspects of the MACD. These typically refer to the 12-period EMA (fast) and 26-period EMA (slow) parameters but can also be used to describe the calculated MACD value (slow) and the derived 9-period EMA (fast).
Note: The signal line is sometimes referred to as the trigger line. Generally, this is seen when both the MACD and Trigger are referred to plurally as signal lines.
Related Article: Calculating the Moving Average in Python
Interpreting the MACD
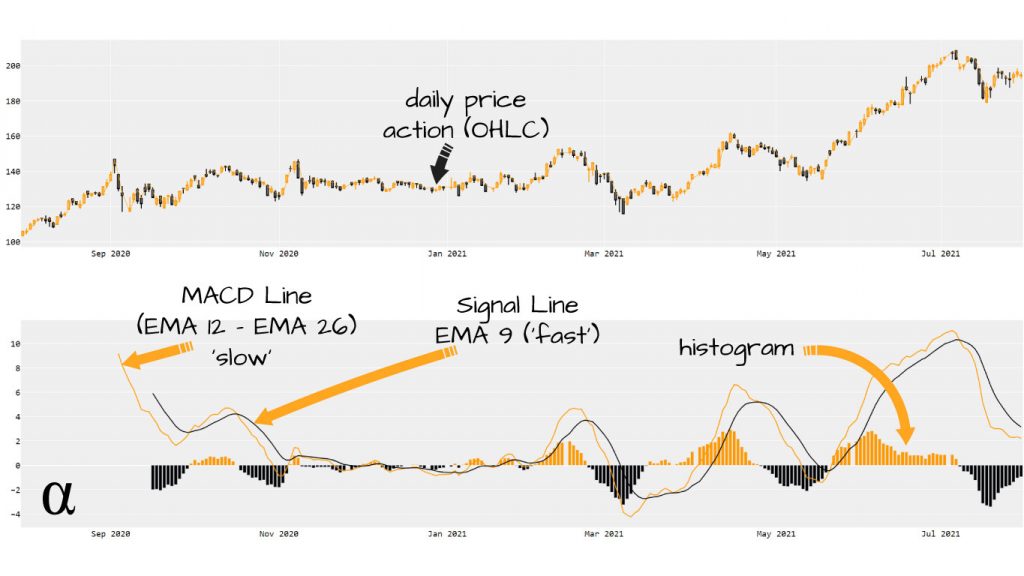
Trading above the trendline indicates an uptrend. Trading below the trendline indicates a downtrend. Several different signals are generated by the MACD and can be interpreted as either lagging or leading signals.
Lagging signals reflect momentum shifts that have already started whereas leading signals are used to predict possible reversals yet to happen. In either case, relying on the MACD alone increases the risk of false signaling. Below are several signals generated by the MACD and possible interpretations.
Crossovers (Lagging)
MACD is a lagging indicator and runs the risk of not signaling a market shift until a price reversal might already be approaching.
- MACD crossing above the centerline – Uptrend
- MACD crossing below the centerline – Downtrend
- MACD crossing above the signal line – Buy
- MACD crossing below the signal line – Sell
Histogram Reversals (leading)
High histogram values indicate strong momentum. When the values are negative, they indicate downward momentum. When the values are positive they represent positive momentum.
Larger histogram values, either positive or negative, indicate a larger separation between the MACD and signal lines. When the histogram values are increasing they reflect divergence. When the histogram values are decreasing they reflect convergence.
Convergence vs. Divergence (lagging)
If the MACD and signal lines moving closer together over time (converging) it signals that momentum is decreasing. If the moving averages are moving farther apart (diverging) momentum is increasing.
This is reflected in histogram values becoming either smaller (convergence) or larger (divergence). Converging values are reflected by histogram bars above the centerline and diverging periods are shown by bars below the centerline.
These signals can help provide a leading strategy whereas other aspects, such as the MACD/Signal crossovers, provide lagging indicators. The strength of momentum leading into crossovers can offer insight into the validity of signals.
Zero Crossovers (lagging)
The crossing of either the MACD or signal line with the centerline can signify a shift in market momentum. When crossing from beneath, this signals a possible shift towards a bullish (upwards) momentum. When crossing from above, this signals a possible shift towards a bearish (downward) momentum.
In more mathematical terms, zero crossovers reflect sign changes—positive to negative or negative to positive—of the MACD or Signal line values. Changes from negative to positive represent possible indicators of uptrends whereas changes from positive to negative represent possible downtrends. The sign can be obtained from the histogram value.
These crossovers are noted as being less frequent among MACD charts but also less prone to generating false signals. These signals are lagging indicators and should be interpreted with caution during periods of volatility. The utility of MACD/Signal crossovers with the centerline is more utilized in signaling longer-term trend reversals.
Market Trends & Breakouts
The MACD can be used to help signal shifts in market trends as well as possible breakouts in price. These interpretations are best framed in the context of broader market indicators such as long-term moving averages (e.g. 200-period SMA) or resistance and support levels. Below are some breakdowns of when and how the MACD can be used to time entries and exits based on signaled trends.
- Can be used to identify high probability breakouts
- When price action near support/resistance levels and histogram signifies weak momentum.
- Can be used to identify market trends; bearish vs. bullish (Murphy, 1999)
- By using 2 x MACDs of different period scales – long period + short period
- when MACD is above signal in longer scale – bullish
- when MACD is below signal in longer scale – bearish
- By using 2 x MACDs of different period scales – long period + short period
- Can be used to time sells/buys
- When strong momentum leading into signal/MACD crossover
- When signal below MACD – sell
- When signal above MACD – buy
- When strong momentum leading into signal/MACD crossover
MACD History
Developed by Gerald Appel in the 1970s. The common settings of 12, 26, 9 reflect the 6-day work week and reflect periods of 2-weeks, 1-month, and 1 1/2 week. A modern 5-day equivalent would be 10, 22, 7. These periodic differences reflect common working conditions prior to the 1938 fair labor act (DOL, 1978.)
Other Applications
The MACD is similar in concept to several non-momentum indicators that can be useful in price analysis as well. For example, the correlation coefficient can help describe the relationship between two unique independent variables (two stock prices for example.)
Like the MACD, correlation analysis can be used to indicate both strength and direction of the linearity among different asset variables. Check out our article on generating correlation matrix heatmaps in Python to get an idea of how to apply that measure.
The MACD can also be used as a feature in more complex modeling such as linear regression analysis or other more complex machine learning algorithms. Check out the article Predicting Stock Prices with Linear Regression in Python for more insight into how the MACD may be applied in such predictive modeling.
Additionally, using certain aspects of the MACD to generate derived values for other common technical indicators—such as the stochastic oscillator—can produce more actionable trading signals. These one-off values can help inform algorithmic models where visual consideration isn’t part of the process. Check out the article on Using the Stochastic Oscillator for Algorithmic Trading in Python for more information.
Final Thoughts
The MACD is one of several momentum indicators heavily utilized by traders of all strategies—day traders, swing traders, momentum traders, and etc. Like many momentum indicators, the signals generated by the MACD can be attributed to mixed-use of moving average calculations. In this case, the interplay between the MACD and Signal lines offers a novel assessment of current market momentum and direction.
The approaches to interpreting the MACD outlined here should be regarded as basic in nature. For example, the MACD is certainly not for chasing breakouts alone—but is helpful to identify possible breakouts. As with many other technical indicators, the MACD is best used alongside other indicators to confirm signals—or even combined with other indicators such as the Stochastic Oscillator.
References
- Appel, Gerald. Technical Analysis: Power Tools for Active Investors. Reprint, FT Press, 2005.
- Murphy, John. Technical Analysis of the Financial Markets: A Comprehensive Guide to Trading Methods and Applications. New York Institute of Finance, 1999.
- United States Department of Labor (DOL). Fair Labor Standards Act of 1938: Maximum Struggle for a Minimum Wage, U.S. Bureau of Labor Statistics Monthly Labor Review, 1978, www.dol.gov/general/aboutdol/history/flsa1938.


