Population and sample are terms commonly used in statistics to describe the percentage of measure within a certain area of focus. A population refers to the entire possible set of all data items within a field of focus while a sample refers to only a select portion.
An example would be the citizenry of the United States—every man, woman, and child—which represent the population. A sample would be a small subgroup of citizens observed with the intent of representing the whole.
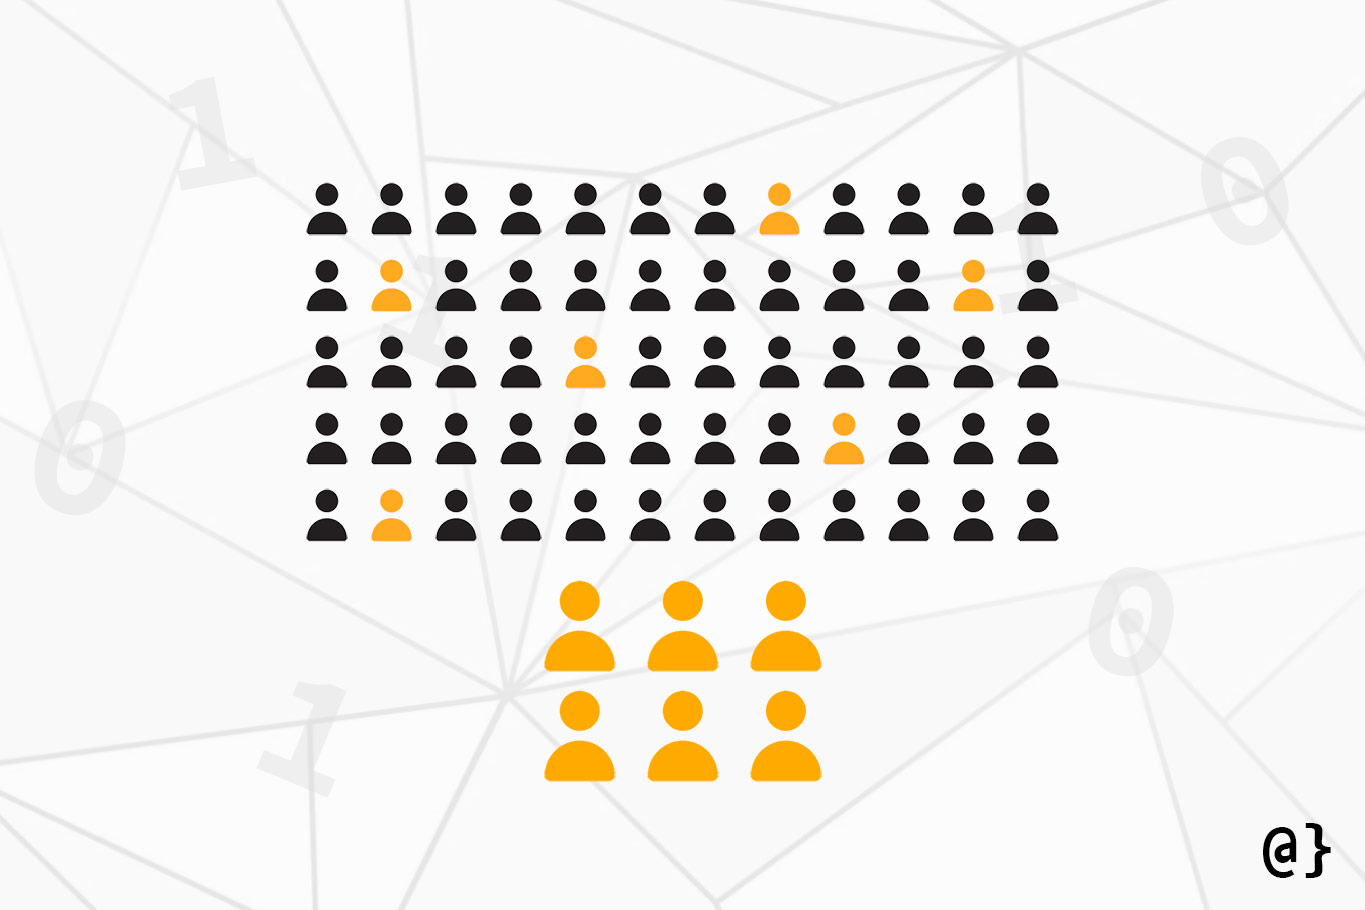
Sample vs. Population
In the illustration below, one can see that the sample population represents only 10% of the total population. Nonetheless, this smaller representative focus provides statisticians with the ability to make accurate and useful predictions without having to sample the entire population—in many cases an impossible feat.

These terms are used to make fundamental distinctions in the field of statistics. As such, many common measures within the field of statistics—mean, standard deviation, median—may apply to either and, as such, be referred to contextually such as population mean, population median, sample standard deviation.
Inferential Statistics vs. Descriptive Statistics
Inferential Statistics is the branch of statistics that endeavors to take measures of sample populations and predict outcomes (parameters) within the larger, whole population. For example, consider standing on the sidewalk next to a Best Buy and asking customers whether they own an iPhone or an Android.
The data gathered in this experiment may only account for a few hundred people from a single geographical location. Descriptive statistics allow one to make explicit conclusions about that group of people; things like 30 out of 100 customers polled own an iPhone. Inferential statistics seeks to make predictions about the entire population.
As such, descriptive statistics are often used to describe sample populations where exact numbers are possible and inferential statistics are used to make predictions about the entire population. After all, it would be impossible to poll every man, woman, and child in the United States to determine the exact figures of iPhone vs. Android use.
Sampling Accuracy
Representative samples of populations can sometimes be less-than-easy to collect. In some cases, in particular studies concerning medical conditions, the randomness of sampling is limited. The goal of sampling is to find a subset of a larger population that is accurately reflective of that larger group.
Narrow sampling methods can cause unwanted (or unrealized) bias leading to a functional error in statistical modeling. For example, sampling 500 people on their way into a fast-food restaurant to model the health and nutrition of the entire country. Eating habits, regional differences, and even differences in economics based on the time of day polled could all be isolated without broader, more random sampling.
Some examples of good formal sampling methods:
- Simple Random Sampling – every member of a larger population has an equally-likely chance of being selected.
- Stratified Random Sampling – population divided into subgroups where and random selections are made from those groups.
- Cluster Random Sampling – the population is divided into subgroups where every member of some groups is selected.
- Systematic Random Sampling – members of the population are ordered and every nth member is selected.
Examples of poor sampling include convenience sampling—selecting nearest people, and volunteer sampling—asking for volunteers (likely to have some bias.) Each of these are likely to lead to poorly descriptive predictions about the larger population.
More generally, sampling methods can be classified as either probability sampling or nonprobability sampling. The former describes the “good” methods while the latter encompasses most of the inaccurate methods.
Parameters vs. Statistics
When measuring an outcome within a population one refers to that measure as a parameter. When measuring an outcome within a sample population that measure is referred to as a statistic. Simply put; a parameter describes the entire population and a statistic describes a sample population. The field of statistics is built on that distinction.
Sampling Errors
The nature of sampling hints that one might never be able to know the total measure of a population parameter. As such, it’s evident that there may be a disconnect between the statistics measured in a sampling population and their prevalence within the larger population.
For example, if 50% of polled North Carolinians reported favoring frozen yogurt, would that accurately measure all Americans? Chances are if one were to poll every citizen in the United States that number wouldn’t be the exact same as a sample population from a single state.
This difference is referred to as a sampling error. The only way to completely eliminate sampling errors is to collect data from the entire population—something that is often impossible or impractical. As such, Statisticians use things like confidence intervals to predict sampling errors to better certify the conclusions drawn from sample models.
Final Thoughts
Statistics has a wide range of vocabulary that, at times, seems almost nonsensical. The same terms are often represented with different symbols, measures like means and standard deviations can be taken from samples or populations, and the same measure may be referred to as a parameter or statistic depending on percentages of a whole.
Keeping track of all these nuances can be difficult, but ultimately important to grasp. Among all such distinctions—the difference between sample populations and whole populations may be the most important within the field.