Estimators are measures taken from sample populations to estimate parameter values for entire populations. An example is the sample mean being utilized to represent the population mean. The value of an estimator is known formally as the estimand and can be categorized into several types, reflecting several characteristics, and goes by several names.
The field of statistics is based on making estimates about a population based on a smaller group (sample.) The values of the measure taken from sample populations can serve as estimators for parameter values of the entire population. The distinction is basic but with many subtle differences in characteristics that may affect measurable outcomes if applied improperly or haphazardly.
TL;DR – Estimators are measured values from sample populations that represent parameter values for the entire population. For example, the sample mean is an estimator for the population mean.
Population vs. Sample

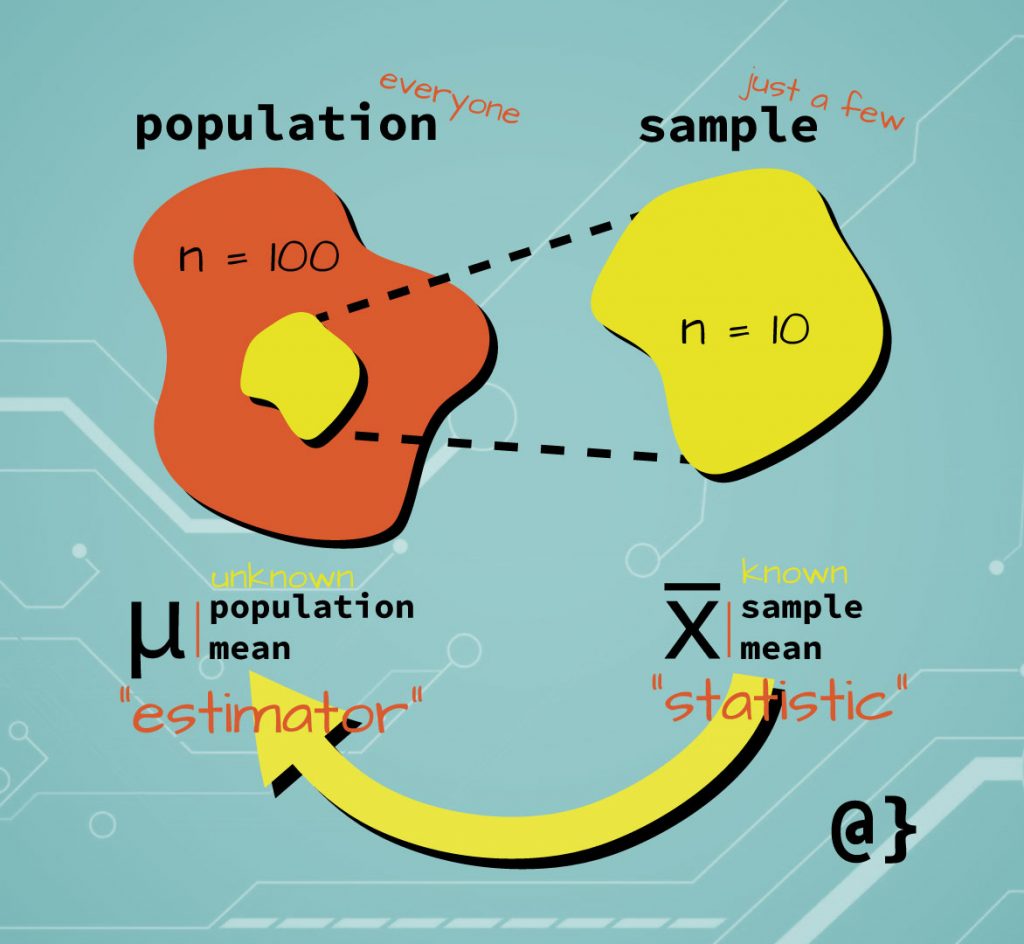
Estimators can be understood by considering the relationship between populations vs. sample populations. A population represents the entirety of a group whereas a sample population represents a smaller portion. Descriptive measures such as mean, standard deviation, and variance are values (a.k.a parameters) when they are obtained from a population. These same measures are called statistics when obtained from a sample population.
Sample populations are used when information about an entire population is not available. For example, the average salary of fifteen Fortune 500 CEOs (a statistic) could be used to estimate the average salary of all Fortune 500 CEOs (a value.) The average salary of the sample population serves as an estimator for the population. The vocabulary can get a tad confusing here, however; the estimator for the population is still considered a statistic for the sample population!
Estimator vs. Statistic

Sample statistics are used to estimate values (a.k.a. parameters) in a population. This is the fundamental basis of the field of statistics—estimating values of large groups based on a smaller number of observations. Similar measures are referred to by different names in many cases. One such case is when discussing both the population and sample population.
The different observational grouping types (sample vs. population) determine when a statistic might be referred to as an estimator. Consider the illustration above: the mean value of the yellow sample group is a statistic, commonly named X-Bar.
The sample mean can also be used as an estimator for the orange population group, where it is then referred to as an estimator. If the entire population was measured it would simply be a value referred to as the population mean, commonly represented by the Greek mu symbol.
Kind of like calling eggs, peppers, onions, and mushrooms ingredients once they have been mixed into a bowel prior to making an omelet. Same stuff—named differently based on its intended use.
Types of Estimators

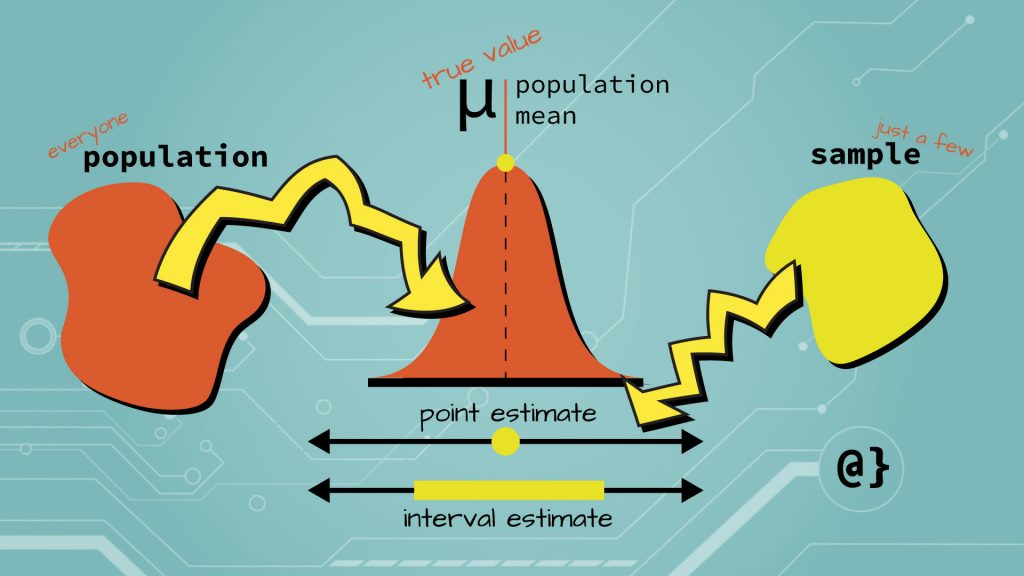
Estimators come in two main types: point estimators and interval estimators. Their names are assigned appropriately in that point estimators represent discrete values (a single point) and interval estimators represent a range of values (an interval of values.)
Point Estimators
Point estimators estimate parameters that are not measurable in the population. These may be parts of partial sets or whole sets of population parameters. In other words, sometimes other population parameters are known while others are not. The use of an estimator for one measure does not guarantee the necessity or use of an estimator for another.
Interval Estimators
Interval estimators are related to confidence intervals in that they represent a range of values in which an appropriate point estimator is likely to be contained. These intervals are typically constructed with a 95% or 99% confidence meaning there is a 95% or 99% probability the estimator value will be contained in that range of values. Higher levels of confidence generally reflect larger intervals of possible values.
Important Estimator Characteristics
Estimators have several traits of which one needs to be aware and characterize the difference between population measures and sample statistics. These characteristics describe the value of an estimator in addition to offering perspective on how and when it might be best considered to represent population parameters.
Bias: The difference between the values of the estimator and the parameter value being estimated. If there is no difference there is no bias.
Consistency: Measure of how closely an estimated value stays to the parameter measure as size increases. Can be checked by the measure of the estimator’s corresponding expected value and variance.
Efficiency: The measure of the variance of all unbiased and consistent estimators and is dependent on the distribution. For example, sometimes the mean is a more efficient measure than the mode.
Invariance: The trait of an estimated to not change as data, interval, or other measure is scaled. Invariance can still apply to a statistic that remains invariant most of the time.
Shrinkage: The reduction of extreme values towards a central value such as the median. Can help provide more stable estimations for population parameters but is subject to bias, especially with asymmetric distributions. Shrinkage estimators are obtained by shrinking raw estimators. Examples include lasso and ridge estimators.
Sufficiency: An estimator is determined as “sufficient” in cases where no other statistic provides additional information. The sample mean is an example of a sufficient estimator.
Final Thoughts
Estimators are powerful tools used to derive parameter values during the development of statistical models. These parameters are used in many applications ranging from linear regression to more advanced machine learning models. Estimators are fundamental statistical tools but come with the potential of advanced nuances to take into consideration. Different distributions are better served from different estimator selections. The key to deriving effective estimators is to be aware of the nuances and characteristics of one’s data and always consider multiple options.


