Everyone who’s anyone in the trading sphere agrees on one thing: Using trading indicators to make sense of the price action charts is critical to success. Today, we’ll review five trading indicators that trading wizards use in their trading apps.
These stock indicators screen for promising, well-managed companies that will likely yield profit for you and your expanding portfolio. These trading indicators will also help you identify key entry and exit points to guarantee you’re always following the smart money right as it’s about to make a big move.
Performing practical Technical Analysis all comes down to combining trading indicators with specific timeframes and strategies to maximize success and profits. We’ll quickly go over each of these indicators to determine how and when to use them during your next trading session.
Trading Indicators
Now more than ever, investors need to understand crowd psychology and the ancient law of supply and demand when they interpret charts and make moves on the market. We live in an incredible era where small investors (with as little as $500) can grab a free trading tool to protect and multiply their salary (or savings) in record time. Still, it all comes with a caveat: knowing how to use trading indicators to predict the next market movement.
Now that the in-depth data monopoly held by smart money is over, the entry barrier has shifted towards how well you can interpret the general market, and it’s precisely what these trading indicators will help you accomplish.
Stock indicators are mathematical calculations drawn from historical data that help us understand how supply and demand work for securities. Incorporating two or more trading indicators into your strategies will help you confirm or refute your hypothesis, allowing you to unearth the market’s intentions before a price move occurs. Because they’re mathematical calculations, these stock indicators will remove emotions and misleading advice from financial decisions that are best taken with an information-driven, objective approach.
Stock Indicators: Moving Averages
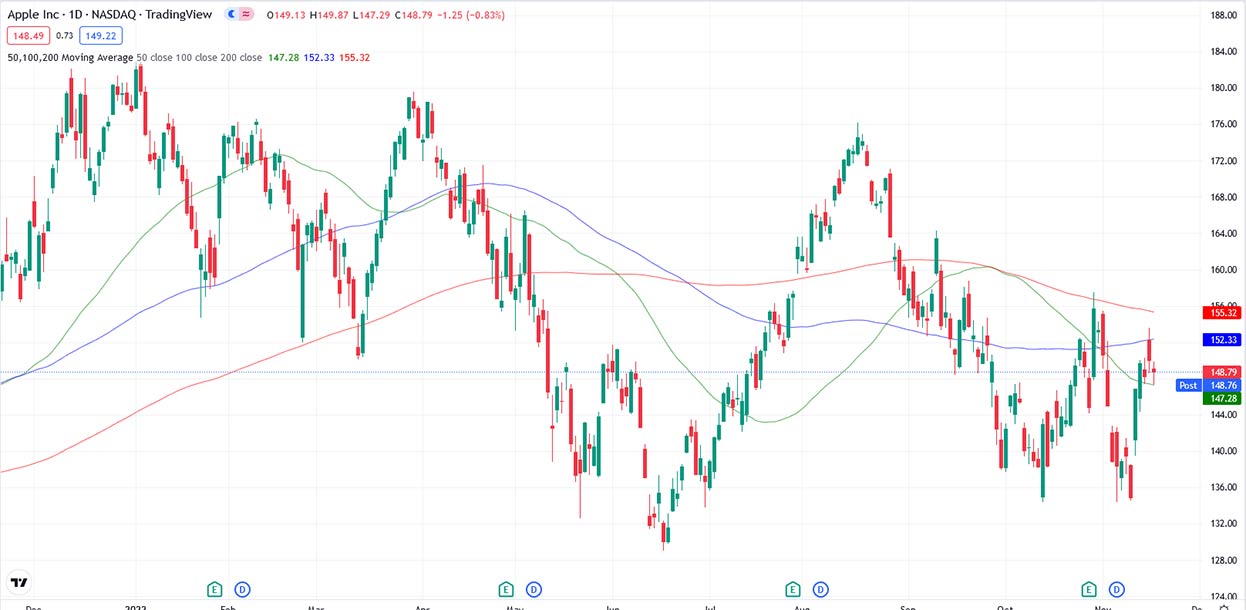
Moving averages are, historically, one of the most popular and reliable stock indicators. This trading indicator is expressed as a single line that averages the price action points over a determined period. Because they use a series of established data points, moving averages are lagging technical indicators that help us identify ongoing trends and may be used in their simple or exponential form.
An exponential moving average works similarly to a regular moving average but adds weight to the most recent data points. These moving averages are used to calculate and visualize specific stock indicators, making them a powerful tool in any trader’s arsenal. Many traders also combine moving averages (each taking different timeframes) to establish support and resistance zones, which are essential in any technical analysis.
Moving averages are central to most trading strategies, so they’re the first tool that beginner traders are introduced to. In fact, one of the most effective trading strategies for novice traders involves using two moving averages alongside the MACD indicator (which uses two different exponential moving averages!). Due to their versatility and near-universal use in strategies, they’re considered one of the best stock indicators.
The Relative Strength Index
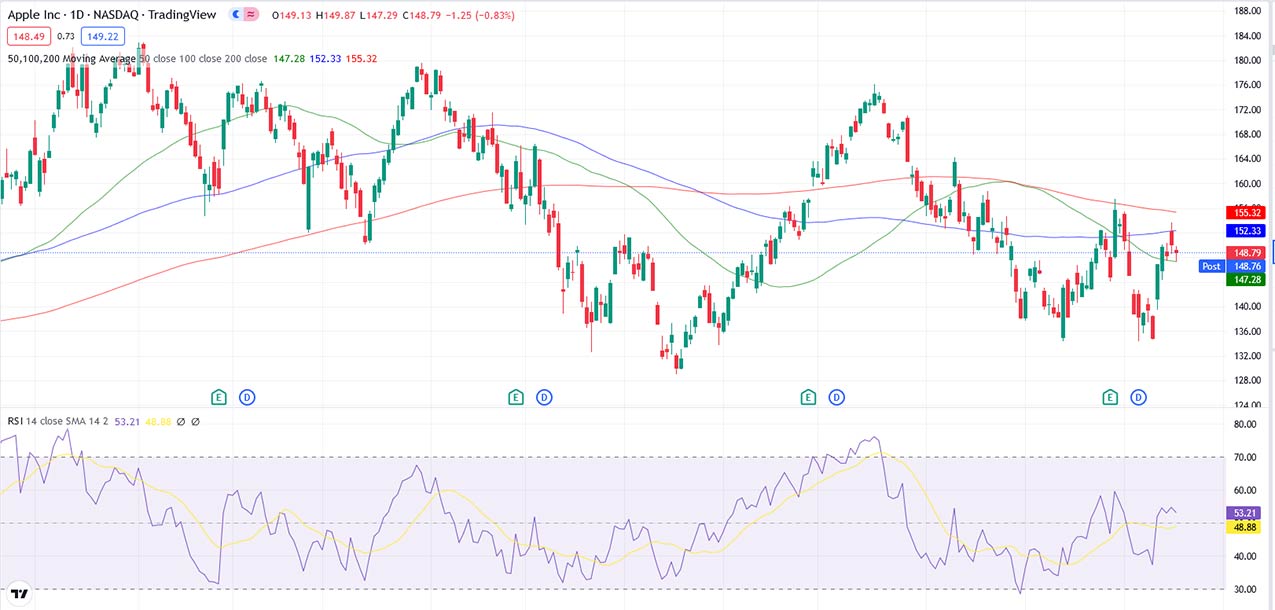
The Relative Strength Index, also known as the RSI, is a stock indicator that allows traders to identify momentum and potential price movements. The RSI is one of the most popular trading indicators because, when used alongside other technical analysis indicators, it can confirm major price action movements, allowing traders to enter a trade just as the stock is about to enter a distribution phase.
The RSI moves between 0 and 100 and constantly plots recent price gains versus recent price losses, which is then formatted into an index form. When the RSI moves above 70, the asset enters an overbought phase, which could translate into a decline in the near future. Because an asset is overbought, any short-term gains are likely to end due to a necessary price correction by the market. On the other hand, when the Relative Strength Index is below 30, the asset is in an oversold phase and is more likely to experience a price shift. Any short-term decline will likely stop and give way to a price rally, which translates into massive profit opportunities for traders that go long.
The RSI, alongside other trading indicators, can accurately predict price reversals right as they’re about to occur, allowing traders to ride the market’s wave as it starts to form in the otherwise uncertain sea that is the market. Because it’s usually the last piece that technical analysis experts need to confirm a price movement theory, it’s considered one of the best trading indicators out there.
The Moving Average Convergence Divergence
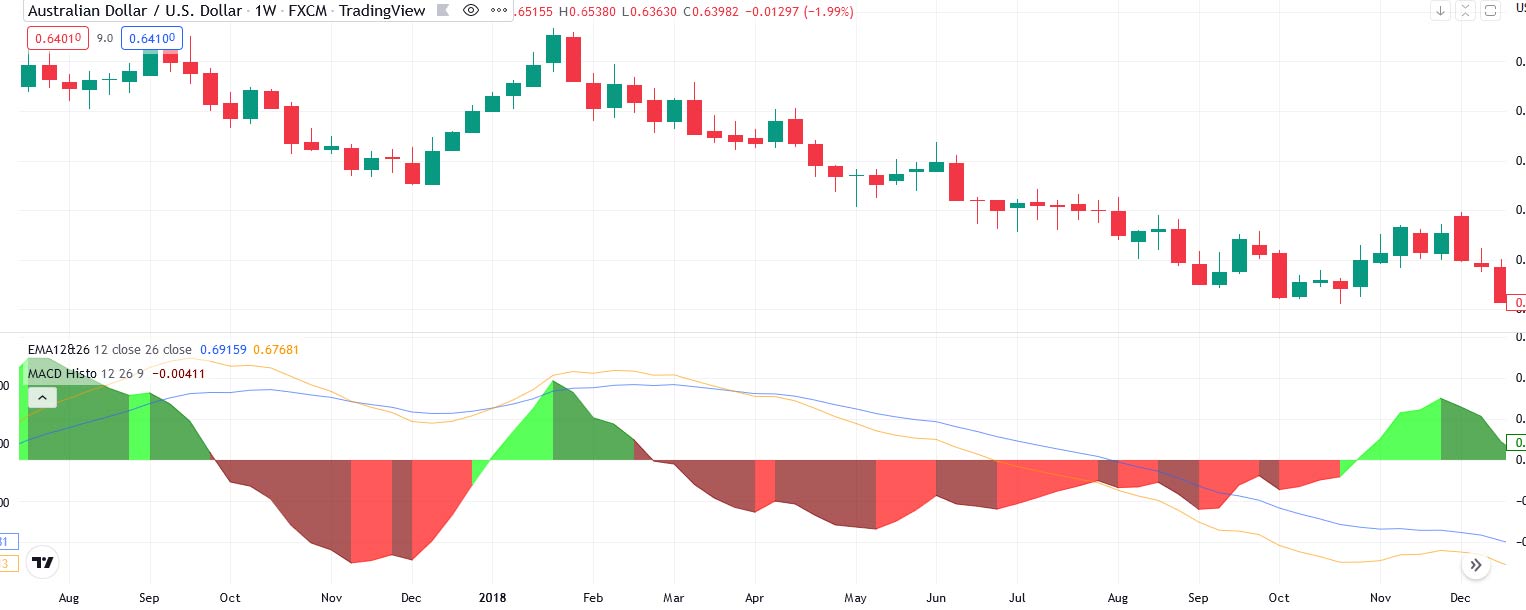
The MACD indicator is, by far, one of the most versatile tools in any trader’s arsenal. It studies the relationship between two exponential moving averages to determine market momentum, reversals, breakouts, or some much-needed trend confirmation. Some day traders even use a MACD variant that pinpoints entry signals in 5-minute charts, which speaks volumes of its versatility and usefulness.
In its most widely-used form, the MACD line is calculated by subtracting the 26-day EMA from the 12-day EMA, while the Signal line is a 9-day EMA of the MACD line. Traders will then observe how the MACD line interacts with the Signal line to buy or sell their stocks as the market shifts. When MACD crosses below the signal line, it indicates that the price is falling. When the MACD line crosses above the signal line, the price rises.
All the most popular trading tools will help you visualize the MACD indicator convergences and divergences with a handy histogram on the subgraph position. This handy data visualization tool will help you make critical decisions that will keep your portfolio well in the green zone. All in all, the MACD indicator is a potent tool that will often provide that critical clue you need to confirm whether or not you should go through with your long or short position.
The EPS Rating
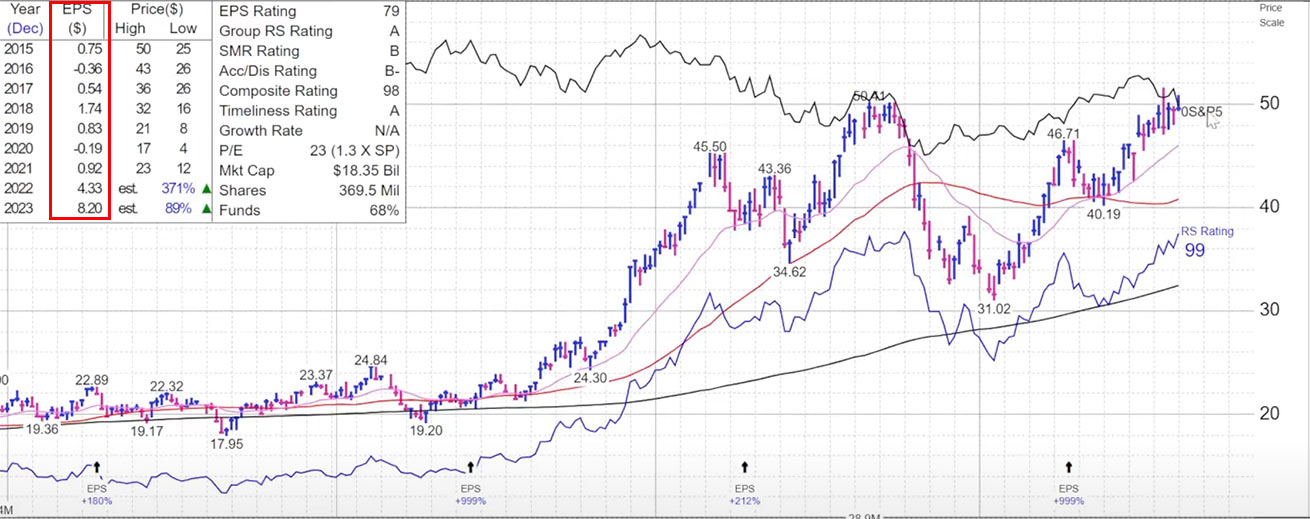
The earnings per share indicator allow traders to distinguish industry leaders and up-and-coming players in a sector from your run-off-the-mill inefficient company. Earnings per share let us know how much money a company makes for each share of its stock, allowing us to reliably calculate a company’s growth, stability, and shares profitability.
Performing practical technical analysis on a particular stock takes time and deliberate effort, so it’s crucial that you exclusively invest time into companies that are worth your hard-earned money. By carefully tracking and investing in profitable stocks with real earning power and earnings growth, you’ll be able to screen stocks in record time and instantly boost your trades’ success rate across the board. It’s an essential stocks indicator for any technical analyst, and in our in-depth piece, we explain exactly how to incorporate it into your trading strategies and tools.
The Accumulation Distribution Indicator
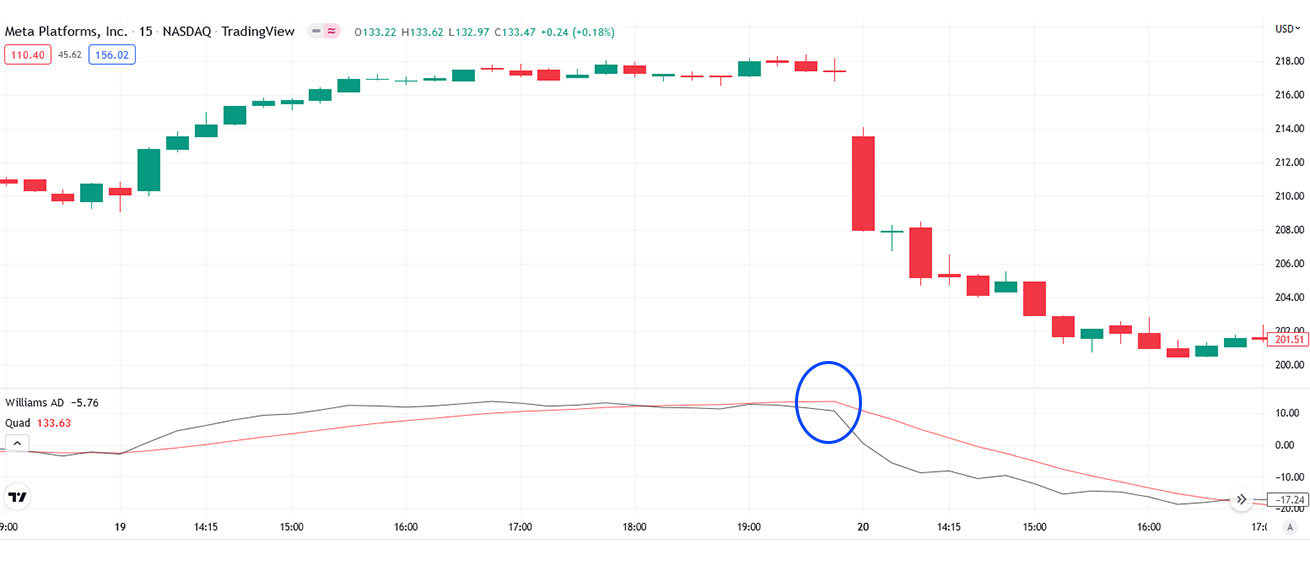
The accumulation distribution indicator is one of the most powerful trading indicators. This volume-based trend indicator has adapted throughout the years and serves as a surprisingly accurate momentum indicator that experts regularly use to confirm and capitalize on market reversals.
The accumulation distribution line showcases the money that enters and exits a security in a straightforward, visual manner. An Accumulation / Distribution line that trends upward translates into considerable buying interest. However, if the A/D line falls, then the security is currently in a downtrend.
That being said, most traders look for divergences between the price action and the A/D line to predict market moves; for instance, an A/D line on a downtrend that contrasts with a rising price action means that a market reversal is imminent. Price action on a downtrend and an accumulation distribution line that rises implies that prices will soar shortly.
Understanding how the accumulation distribution indicator works with accumulation and distribution phases is essential, especially if you’re looking to capitalize on market moves directly caused by smart money. Our guide explains in great detail how to identify accumulation and distribution phases and how you can enter a trade right as a stock is about to skyrocket or plummet, ensuring that you’re always on the winning side of a trade.
Trading Indicator Limitations
Technical analysis is all about using the best trading indicators as pieces in a larger puzzle. As powerful as they are, even the best trading indicator cannot ensure a 100% success rate trading strategy that will take your portfolio to new heights. Instead, you’re supposed to take each of these indicators and weave them into a comprehensive trading strategy that will allow you to get a reasonable success rate over time.
Your theories regarding a specific trade will likely be substantiated by market psychology, behavioral economics, and a good measure of quantitative analysis. On the other hand, each of these trading indicators excels at either confirming trends, measuring momentum, predicting market reversals, and even timing your entrance or exit. Together, they can confirm or disprove your theories on how the price action will move in the short and long term.
Combining your trading strategy with effective risk management will allow you to come out ahead even in bear markets. While not even modern trading wizards can come out on top in 100% of their trades, their strong understanding of the market and financial analysis will allow them to trade with a higher-than-average success rate. Effective technical analysis is, without question, an integral part of success as a trader. Still, it takes experience, careful observation, and a certain level of emotional detachment to see past theories and trust the numbers and insight these powerful trading indicators provide.
What Is Technical Analysis
Technical analysis uses quantitative analysis, behavioral economics, and market psychology to analyze previous market performance and predict future market behaviors and trends. It can be applied to any security, provided it has sufficient historical trading data that the analyst can review, including stocks, currencies, and many others.
In a nutshell, Technical Analysis uses various tools to carefully analyze how supply and demand interact through a security’s price movement and volume. To that end, it uses a mix of trading indicators, patterns that repeat throughout history, and current trend lines to predict future market movement.
By utilizing chart patterns, analysts can pinpoint support and resistance levels, while trading indicators can predict future market moves based on price, volumes, and previous statistical data. When evaluated in the context of price market cycles, other stock indicators can even predict market reversals and other market entry and exit signals that will maximize a trader’s profit.
By combining these analysis tools, traders can create reasonable hypotheses and strategies that dramatically improve a trader’s success rate and portfolio strength. Technical analysis requires using several trading indicators to substantiate price movement theories, making it an equally powerful and nuanced tool for all traders.
Review
Technical analysis is an essential tool behind every successful trader’s portfolio. But it’s also a double-edged sword that can ruin an otherwise promising future in trading when improperly integrated into your trading strategies. Some technical analysts attempt to weave niche trading indicators into improvised trading strategies to “beat” the market and grow portfolios overnight, only to find themselves on the losing end of their trades.
If you’re a beginner, sticking to well-established trading indicators and getting a feel of how and when to use them to confirm or disprove individual theories marks the road to success. Understanding the fundamentals is essential, and the trading indicators we’ve listed here today are an excellent foundation you can incorporate into your trading today!


